Invest Daily Pro
  • Economy
  • Investing
No Result
View All Result
  • Economy
  • Investing
No Result
View All Result
Invest Daily Pro
No Result
View All Result
Home Stocks

How to Trade Erratic Uptrends – An Example and Setup using IWM

by Invest Daily Pro
January 8, 2025
in Stocks
0
How to Trade Erratic Uptrends – An Example and Setup using IWM
0
SHARES
7
VIEWS
Share on FacebookShare on Twitter

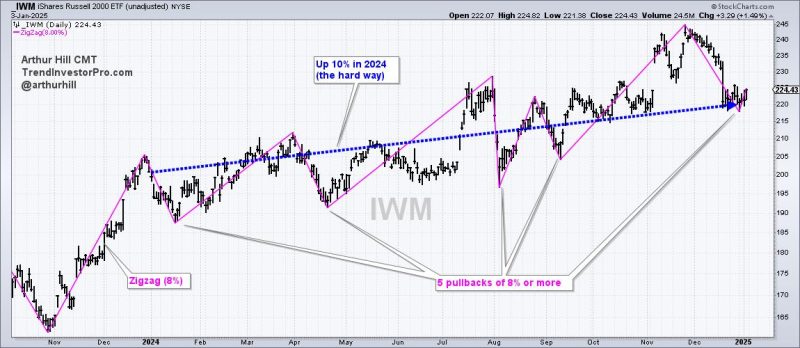
The Russell 2000 ETF managed a double-digit gain in 2024, but did it the hard way with several deep pullbacks. Pullbacks within uptrends are opportunities and we can find such opportunities using %B.

The chart below shows the Russell 2000 ETF (IWM) with the Zigzag(8) indicator. This indicator changes direction when there is a move greater than 8%, which means it ignores price moves that are less than 8%. I am showing this indicator to highlight five pullbacks of 8% or more in 2024. That’s a lot. In contrast, the S&P 500 SPDR (SPY) only experienced one 8+ percent pullback in early August.

Overall, IWM advanced 10% in 2024. That seems like a good year, but it was a “hard” 10% when we include the five 8+ percent pullbacks. This is simply the nature of small-cap stocks. They are less “trendy” than large-caps and have higher betas, making them more susceptible to wider fluctuations. Traders need to consider this when trading small-caps. As noted in Chart Trader this week, we see similar price action in the S&P 500 EW ETF (RSP) and S&P MidCap 400 SPDR (MDY).

Click here to take Chart Trader trial and get immediate access.

Buying upside breakouts is probably not the best strategy for trading IWM. Instead, traders should consider pullbacks and mean-reversion opportunities. We can identify such opportunities using Bollinger Bands (20,2) and %B (20,2). The middle line on the Bollinger Bands is the 20-day SMA and the bands are two standard deviations above and below. A close below the lower band means price fell two standard deviations and this creates an oversold condition.

Chartists can quantify oversold conditions using %B, which falls below 0 when the close is below the lower Bollinger Band. The blue lines on the chart above show %B dipping below 0 four times in 2024. Note that I would also only look for oversold conditions when price is above the 200-day SMA (long-term uptrend). When the bigger trend is up, a close below the lower Bollinger Band signals an oversold condition that can lead to a bounce.

December was a rough month for many stocks and ETFs. Even so, the weight of the evidence remains bullish for stocks and these pullbacks look like corrections within bigger uptrends. This week’s reports and videos focused on long-term breadth indicators, short-term oversold breadth, leading ETFs and a dozen ETFs with tradable pullbacks.

Click here to take a Chart Trader trial and get immediate access.

///////////////////////////////////////////////

ShareTweetPin

Related Posts

Chart Mania – 23 ATR Move in QQQ – Metals Lead 2025 – XLV Oversold – XLU Breakout – ITB Moment of Truth
Stocks

Chart Mania – 23 ATR Move in QQQ – Metals Lead 2025 – XLV Oversold – XLU Breakout – ITB Moment of Truth

July 26, 2025
Momentum Leaders Are Rotating — Here’s How to Find Them
Stocks

Momentum Leaders Are Rotating — Here’s How to Find Them

July 25, 2025
S&P 500 Breaking Out Again: What This Means for Your Portfolio
Stocks

S&P 500 Breaking Out Again: What This Means for Your Portfolio

July 25, 2025
A Wild Ride For the History Books: 2025 Mid-Year Recap
Stocks

A Wild Ride For the History Books: 2025 Mid-Year Recap

July 24, 2025
Is META Breaking Out or Breaking Down?
Stocks

Is META Breaking Out or Breaking Down?

July 24, 2025
Tech Taps the Brakes, Homebuilders Hit the Gas: See the Rotation on StockCharts Today
Stocks

Tech Taps the Brakes, Homebuilders Hit the Gas: See the Rotation on StockCharts Today

July 23, 2025
Next Post
Cybersecurity Market Forecast: Top Trends for Cybersecurity in 2025

Cybersecurity Market Forecast: Top Trends for Cybersecurity in 2025

Recommended

Acceleration of RAD204 Phase 1 dose escalation trial

Acceleration of RAD204 Phase 1 dose escalation trial

May 12, 2025
LaFleur Minerals Closes $1.66 Million Flow-Through Offering to Advance Drilling and PEA-Related Work at its Swanson Gold Deposit

LaFleur Minerals Closes $1.66 Million Flow-Through Offering to Advance Drilling and PEA-Related Work at its Swanson Gold Deposit

November 1, 2025
SMC’s first-half income jumps to P33.5B on strong segment performance

SMC’s first-half income jumps to P33.5B on strong segment performance

August 12, 2024
Big banks post double-digit growth in loans, assets in Q3

Big banks post double-digit growth in loans, assets in Q3

December 8, 2024
Celebrity Dental Implants Before and After

Celebrity Dental Implants Before and After

November 30, 2024
Philippines’ August joblessness eases

Philippines’ August joblessness eases

October 8, 2024

    Stay updated with the latest news, exclusive offers, and special promotions. Sign up now and be the first to know! As a member, you'll receive curated content, insider tips, and invitations to exclusive events. Don't miss out on being part of something special.


    By opting in you agree to receive emails from us and our affiliates. Your information is secure and your privacy is protected.

    Steve Penny: Silver’s Big Move Still to Come, Watch This Price Trigger

    Steve Penny: Silver’s Big Move Still to Come, Watch This Price Trigger

    January 22, 2026
    Skyharbour Announces Major 2026 Exploration Campaign with Denison Mines at Russell Lake Uranium Joint Ventures

    Skyharbour Announces Major 2026 Exploration Campaign with Denison Mines at Russell Lake Uranium Joint Ventures

    January 22, 2026
    Cyprium Metals Limited (ASX: CYM) – Trading Halt

    Cyprium Metals Limited (ASX: CYM) – Trading Halt

    January 21, 2026
    • About us
    • Contact us
    • Privacy Policy
    • Terms & Conditions

    Copyright © 2026 investdailypro.com | All Rights Reserved

    No Result
    View All Result
    • About us
    • Contact us
    • Home
    • Privacy Policy
    • Suspicious engagement
    • Terms & Conditions
    • Thank you

    Copyright © 2026 investdailypro.com | All Rights Reserved