The 10-Year Treasury Yield has gone up a full percentage point, from a low of 3.6% in September 2024 to a level of 4.6% this week. So what does this rapid rise in interest rates mean for your portfolio? Let’s look at the shape of the yield curve by comparing multiple maturities, review how recent moves on the yield curve relate to previous recessionary periods, and analyze the most important charts to gauge a potential impact.
Higher Rates Mean Bad News for Borrowers
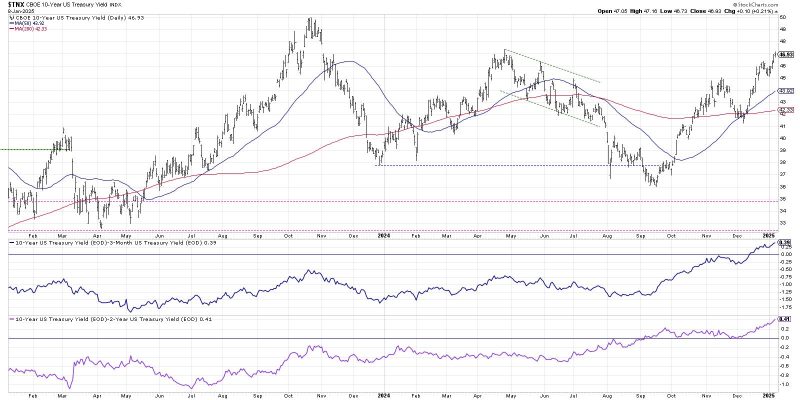
The chart of the 10-Year Treasury Yield ($TNX) has effectively been in a wide trading range since mid-2023. The 10-Year has fluctuated between lows around 3.6-3.8% and highs in the 4.7-5.0% range. As we’re now seeing a 4.7% yield on the 10-Year, we could be setting up for a retest of the 2023 high around 5.0%.
Higher rates can definitely put pressure on industry groups like homebuilders, because this move in the 10-Year means new home buyers can expect much higher mortgage payments. In terms of broad market implications, the shape of the yield curve could have even more significance in the coming months.
The bottom two panels show the spread between the 10-year point on the yield curve compared to two other maturities: the 3-month and 2-year points. In recent years, we have experienced an inverted yield curve, where the short-term yields are higher than long-term yields. But with the Fed lowering short-term rates, and long-term rates turning back higher, we once again have a normal shaped yield curve.
The Yield Curve Is No Longer Inverted — So What?
Investors love to debate whether a recession is likely, because that confirms that the economy is no longer growing as it usually does. But given the lag in economic data, investors can actually look at the shape of the yield curve to determine if conditions are present that suggest a recessionary period is coming.
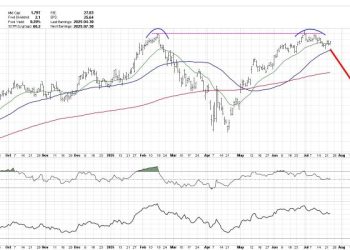
Here, we’re taking the 2-year vs. 10-year points on the yield curve and plotting that spread back to 1985. I’ve placed a red vertical line where the yield curve turned back to a normal shape after being inverted, and I’ve also included orange-shaded areas which represent recessionary periods.
You may notice that over the last 40 years, every time we’ve had an inverted yield curve where the spread then turned back positive, we’ve seen a recession soon afterwards. You may also notice that the performance of the S&P 500 (bottom panel) confirms that the yield curve moving back to a normal shape usually happens just before a bear market begins.
While the long-term implications of a normal shaped yield curve are bullish, as they imply optimism about future economic growth, the reality is that the short-term environment for stocks is usually fairly unstable.
Market Trend Is What Matters Most
So what do we do given this bearish headwind for stocks going into 2025? I would argue that now, more than ever, it pays to follow the trend. As long as the medium-term and long-term trends in the S&P 500 remain constructive, then I’ll want to follow that uptrend until proven otherwise.
My Market Trend Model is designed to track the trend in the S&P 500 on three time frames: short-term (a couple days to a couple weeks), medium-term (a couple months), and long-term (over a year). As of mid-December, the short-term model turned bearish for the S&P 500. The medium-term and long-term models remain bullish through last Friday.
I consider the medium-term trend to be the most important, as it serves as my main “risk on/risk off” measure. When the model is bullish, that tells me to look for long ideas and take on additional risk. When the model is bearish, that tells me to focus more on capital preservation than capital growth.
The short-term model turned negative five times in 2024, but the medium-term model remained bullish in all five cases. This helped me understand that those were brief pullbacks within a longer uptrend phase. If and when the medium-term model turns negative, you’ll hear me take on a much more cautious tone on my market recap show, as I’ll be looking for opportunities to take risk off the table.
RR#6,
Dave
P.S. Ready to upgrade your investment process? Check out my free behavioral investing course!
David Keller, CMT
President and Chief Strategist
Sierra Alpha Research LLC
Disclaimer: This blog is for educational purposes only and should not be construed as financial advice. The ideas and strategies should never be used without first assessing your own personal and financial situation, or without consulting a financial professional.
The author does not have a position in mentioned securities at the time of publication. Any opinions expressed herein are solely those of the author and do not in any way represent the views or opinions of any other person or entity.


