Invest Daily Pro
  • Economy
  • Investing
No Result
View All Result
  • Economy
  • Investing
No Result
View All Result
Invest Daily Pro
No Result
View All Result
Home Stocks

Market Pullbacks Provide Opportunities to Build your WatchList – Here’s How

by Invest Daily Pro
January 12, 2025
in Stocks
0
Market Pullbacks Provide Opportunities to Build your WatchList – Here’s How
0
SHARES
10
VIEWS
Share on FacebookShare on Twitter

The stock market is in pullback mode with the S&P 500 EW ETF down 5.15% over the past month and down 1% year-to-date. This makes it a good time to monitor relative performance and create a relative strength watch list. Stocks and ETFs holding up best during pullbacks often lead when the market regains its footing. Today’s report will show a starter list and analyze the chart for an AI Robotics ETF.

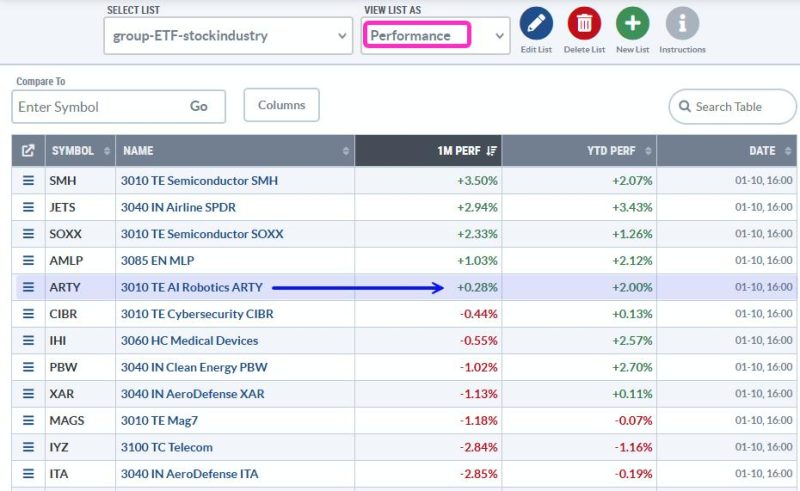
The table below shows 1-month and year-to-date performance for a selection of industry group ETFs. With the S&P 500 EW ETF down on both timeframes, ETFs with gains are holding up well and ETFs with smaller losses show relative strength (less weakness). Five ETFs are up on both timeframes and holding up well in the face of broad market weakness.

Note that this list is simply the first cut. I would make a further cut by insuring that the ETF is in a long-term uptrend. For example, the Clean Energy ETF (PBW) is below its 200-day SMA and would not make the cut. The Medical Devices ETF (IHI) and Robotics AI ETF (ARTY) are in long-term uptrends, and make the cut. Let’s look at ARTY. A recent Chart Trader report/video highlighted the recent breakout in IHI.

The chart below shows ARTY hitting a new high in early December and price above the rising 200-day SMA. ARTY is in a long-term uptrend. There was a big breakout in mid October, an oversold reading in late October and then a 17% run to new highs. ARTY then formed a pennant and broke out with a surge earlier this week, only to fall back the last three days. Overall, I think the pennant breakout is still bullish and this is a throwback to the breakout zone. A break below the pennant lows would negate this pattern and argue for a deeper correction.

Chart Link

The middle window shows the price-relative (ARTY/RSP Ratio) breaking above its 200-day SMA in late November. ARTY shows relative strength and the price-relative hit a new high in early January. The lower window shows %B, which I use to identify oversold conditions within an uptrend. A dip below 0 means the close is below the lower Bollinger Band. This means there was a pullback within the uptrend, which is an opportunity.

I will be following ARTY and other leading ETFs closely in the Chart Trader reports and videos. Our reports warned of the breakout in the 10-yr Treasury Yield in before Christmas (HERE) and we also showed how to distinguish between a robust bounce and a dead cat bounce (HERE).

Click here to take Chart Trader trial and get immediate access.

//////////////////////////////////////////////////

ShareTweetPin

Related Posts

Chart Mania – 23 ATR Move in QQQ – Metals Lead 2025 – XLV Oversold – XLU Breakout – ITB Moment of Truth
Stocks

Chart Mania – 23 ATR Move in QQQ – Metals Lead 2025 – XLV Oversold – XLU Breakout – ITB Moment of Truth

July 26, 2025
Momentum Leaders Are Rotating — Here’s How to Find Them
Stocks

Momentum Leaders Are Rotating — Here’s How to Find Them

July 25, 2025
S&P 500 Breaking Out Again: What This Means for Your Portfolio
Stocks

S&P 500 Breaking Out Again: What This Means for Your Portfolio

July 25, 2025
A Wild Ride For the History Books: 2025 Mid-Year Recap
Stocks

A Wild Ride For the History Books: 2025 Mid-Year Recap

July 24, 2025
Is META Breaking Out or Breaking Down?
Stocks

Is META Breaking Out or Breaking Down?

July 24, 2025
Tech Taps the Brakes, Homebuilders Hit the Gas: See the Rotation on StockCharts Today
Stocks

Tech Taps the Brakes, Homebuilders Hit the Gas: See the Rotation on StockCharts Today

July 23, 2025
Next Post
Heritage Mining

Heritage Mining

Recommended

DMCI stockholders OK share issuance for Cemex purchase

DMCI stockholders OK share issuance for Cemex purchase

October 15, 2024
BEST Options Trading IDEAS This Week!

BEST Options Trading IDEAS This Week!

January 8, 2025
Dennis Lustico: 50 pieces for 25 years

Dennis Lustico: 50 pieces for 25 years

October 13, 2024
SM group keen on more projects with gov’t

SM group keen on more projects with gov’t

September 2, 2024
Government targets large firms in crackdown on late payments to small businesses

Government targets large firms in crackdown on late payments to small businesses

September 19, 2024
Easier Korean visa application for Filipinos this winter

Easier Korean visa application for Filipinos this winter

September 9, 2024

    Stay updated with the latest news, exclusive offers, and special promotions. Sign up now and be the first to know! As a member, you'll receive curated content, insider tips, and invitations to exclusive events. Don't miss out on being part of something special.


    By opting in you agree to receive emails from us and our affiliates. Your information is secure and your privacy is protected.

    NevGold Mobilizes Drill To Test Historical Leach Pads To Advance The Near-Term Antimony Production Scenario at Limo Butte

    NevGold Mobilizes Drill To Test Historical Leach Pads To Advance The Near-Term Antimony Production Scenario at Limo Butte

    March 14, 2026
    Cartier Cuts 7.1 g/t Au over 8.0 m at Portal ; New Shallow High-Grade Gold Zone Discovered

    Cartier Cuts 7.1 g/t Au over 8.0 m at Portal ; New Shallow High-Grade Gold Zone Discovered

    March 14, 2026
    Crypto Market Update: Iran War Drives Oil Derivatives Boom on Crypto Exchange

    Crypto Market Update: Iran War Drives Oil Derivatives Boom on Crypto Exchange

    March 12, 2026
    • Privacy Policy
    • Terms & Conditions

    Copyright © 2026 investdailypro.com | All Rights Reserved

    No Result
    View All Result
    • Home
    • Privacy Policy
    • Terms & Conditions
    • Thank you

    Copyright © 2026 investdailypro.com | All Rights Reserved