
While StockCharts offers numerous tools you can use to find top stocks or top-gaining stocks, I decided to focus on an Outperforming SPY: 3-Month Relative Highs scan to see if I can find a few resilient stocks in early-stage trends, especially after Monday’s huge market rout.
FIGURE 1. THE OUTPERFORMING SPY SECTION OF THE PREDEFINED SCAN GROUP. I went with the first scan to find stocks that outperformed SPY over three months.Image source: StockCharts.com. For educational purposes.
What I found were two cloud-based tech stocks at different trend stages: Snowflake (SNOW) and Twilio, Inc. (TWLO). It turns out that both were garnering attention on Wall Street due to their recent earnings performances:
- SNOW surged late last year on strong financial performance and strategic AI advancements.
- TWLO’s jump to an all-time high can be attributed to several analysts recent “buy” ratings and upward price target revisions, following the company’s strong earnings results and guidance.
Also, note that both stocks have a StockChartsTechnicalRank (SCTR) above the 90 line, indicating extreme bullishness across multiple technical indicators and timeframes.
FIGURE 2. RESULTS OF THE SCAN. When you run a scan, consider categorizing stocks by volume to list the most liquidly traded stocks from the top down.Image source: StockCharts.com. For educational purposes.
While outperforming SPY, an S&P 500 proxy, points to recent developments in the stock, it’s always good to get a bigger-picture view of relative performance. In light of this notion, take a look at a one-year chart illustrating relative performance between $SPX, SNOW, and TWLO.
FIGURE 3. PERFCHARTS RELATIVE PERFORMANCE OF SPY, SNOW, AND TWLO. This gives you a one-year perspective on the relative outperformance and underperformance of the two stocks.Chart source: StockCharts.com. For educational purposes.
This adds more depth to the comparison. It also makes you wonder if TWLO and SNOW are overvalued and undervalued, respectively, relative to the S&P 500 on a purely technical basis.
With that in mind, let’s start with a daily chart of SNOW.
FIGURE 4. DAILY CHART OF SNOW. Note the conflicting volume-based indicators. You’ll need to analyze this divergence to get a clearer set of possible interpretations.Chart source: StockCharts.com. For educational purposes.
SNOW is breaking above resistance (and its most recent swing high) at roughly $187. The nearest level of support can be found at its most recent swing low at the $153 range. Note the significant earnings-driven gap late November; a range it might retest should SNOW’s breakout fail. SNOW’s price momentum has pushed it toward the early stages of an overbought condition, as indicated by the Relative Strength Index (RSI).
If that’s relatively straightforward, the picture presented by the volume indicators is much more confusing. The On Balance Volume (OBV) indicates strong buying pressure, but the Accumulation/Distribution Line (ADL) behind the price suggests a drastic weakening in money flows. What might this mean? Here are a few possibilities:
- Institutional distribution and false strength, or institutional sellers absorbing retail demand.
- Rally or trend exhaustion.
- If price holds above support, it can also indicate hidden accumulation.
Your actionable step: Add SNOW to your ChartLists and track its price movement relative to support and resistance levels. This will help you better understand its potential direction, assuming that it’s supported by momentum and volume.
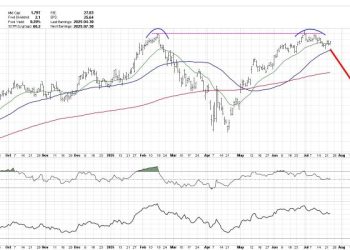
Now let’s shift over to a daily chart of TWLO.
FIGURE 5. DAILY CHART OF TWLO. Strong breakaway gap, but possibly well-overbought.Chart source: StockCharts.com. For educational purposes.
TWLO experienced a parabolic jump following a breakaway gap just last week. While the OBV underscores the bullish optimism, showing strong buying pressure, the Chaikin Money Flow (CMF) signals that selling pressure is now greater than buying pressure.
Is this another case, similar to SNOW, of retail strength buying into institutional selling? Or will accumulation continue once TWLO has pulled back? After all, the RSI is signaling overbought conditions, and TWLO is well above the upper Bollinger Band.
For now, add TWLO to your ChartLists and wait for it to pull back to the middle Bollinger Band. If you’re bullish on TWLO, such a pullback would present a strong buying opportunity as long as price doesn’t fall below $105, the bottom level of the month-long congestion range.
At the Close
SNOW and TWLO have shown strong relative performance and bullish momentum, but conflicting volume indicators suggest caution. Monitoring key support and resistance levels, along with volume and momentum, will provide better clarity on their next moves. Keep them on your ChartLists and monitor them for confirmation before taking action.
Disclaimer: This blog is for educational purposes only and should not be construed as financial advice. The ideas and strategies should never be used without first assessing your own personal and financial situation, or without consulting a financial professional.


