Invest Daily Pro
  • Economy
  • Investing
No Result
View All Result
  • Economy
  • Investing
No Result
View All Result
Invest Daily Pro
No Result
View All Result
Home Stocks

An Enticing Gold Mining Stock with a Strong SCTR Score

by Invest Daily Pro
January 31, 2025
in Stocks
0
An Enticing Gold Mining Stock with a Strong SCTR Score
0
SHARES
2
VIEWS
Share on FacebookShare on Twitter

Gold stocks have risen, even after the Federal Reserve decided to keep interest rates unchanged. So it wasn’t surprising to find a few gold mining stocks filtered in my StockCharts Technical Rank (SCTR) scan. (This scan was created using StockCharts’ Advanced Scan Workbench and can be found at the end of the article for reference.)

I selected Alamos Gold, Inc. (AGI), a gold mining stock in the materials sector for further analysis. Gold mining stocks have been rising, as have gold prices, and, with AGI trading at around $21, the stock is worth considering as an addition to a portfolio. 

A Deep Dive Into Alamos Gold

AGI has had an interesting run since late 2022, after it broke out of a shallow downward-sloping sideways range. The stock rode higher, moved sideways for almost a year, and then continued its upward trend. It pulled back again from late October 2024 to January 2025; it is now trading above its 21-week exponential moving average (EMA) and challenging its all-time highs.

FIGURE 1. WEEKLY CHART OF GOLD MINING STOCK ALAMOS. The stock has been trending higher since early 2024 and is now battling with its all-time highs.Chart source: StockCharts.com. For educational purposes.

When a stock reaches its all-time high, that could be an incentive to go even higher. But there needs to be momentum. There are a handful of momentum indicators you could use, such as the relative strength index (RSI), moving average convergence/divergence (MACD), and average directional index (ADX).

Let’s look at the daily chart of AGI to identify potential entry points.

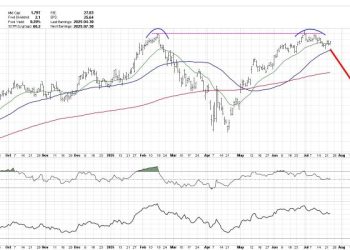
FIGURE 2. DAILY CHART OF ALAMOS GOLD. The SCTR score is 82.50, the price is very close to its 52-week high (in this case, an all-time high), and RSI is almost 70. The stock is also trading well above its 15-day EMA.Chart source: StockChartsACP. For educational purposes.

The Distance to 52-Week Highs indicator in the lower panel shows AGI is close to its 52-week high. The SCTR score is above 80, volume is picking up, the stock is trading above its 15-day EMA, and the RSI has been trending higher, just shy of 70. All indicators point to AGI retaining its bullish move.

AGI failed to close at a new all-time high on Thursday. It’s worth monitoring the stock’s momentum to see if it can close at a new high and push through it. If not, consider catching it on a pullback and trying to ride the wave up. It could be a golden opportunity.

However, as we know too well, things can change. If the dynamics of AGI start shifting — i.e. the SCTR score falls, the stock price moves closer to its 15-day EMA, or the RSI reverses and approaches the 50 line — then it may be time to exit the stock.

As always, if any of the indicators start reversing, which would suggest that the stock’s strength is declining, you may be better off moving on to find more promising investments.

The SCTR Scan

[country is US] and [sma(20,volume) > 100000] and [[SCTR.us.etf x 76] or [SCTR.large x 76] or [SCTR.us.etf x 78] or [SCTR.large x 78] or [SCTR.us.etf x 80] or [SCTR.large x 80]]


Disclaimer: This blog is for educational purposes only and should not be construed as financial advice. The ideas and strategies should never be used without first assessing your own personal and financial situation, or without consulting a financial professional.

ShareTweetPin

Related Posts

Breakouts, Momentum & Moving Averages: 10 Must-See Stock Charts Right Now
Stocks

Breakouts, Momentum & Moving Averages: 10 Must-See Stock Charts Right Now

June 2, 2025
Breakouts, Momentum & Moving Averages: 10 Must-See Stock Charts Right Now
Stocks

Breakouts, Momentum & Moving Averages: 10 Must-See Stock Charts Right Now

June 1, 2025
Week Ahead: NIFTY Stays In A Defined Range; Moving Past This Level Crucial For Resumption Of Upmove
Stocks

Week Ahead: NIFTY Stays In A Defined Range; Moving Past This Level Crucial For Resumption Of Upmove

June 1, 2025
Run Your Stock Portfolio Like a Pro Sports Team
Stocks

Run Your Stock Portfolio Like a Pro Sports Team

May 31, 2025
Leadership Rotation Could Confirm Corrective Phase
Stocks

Leadership Rotation Could Confirm Corrective Phase

May 31, 2025
Analyzing SIL, USO, and NVDA: Could These Bullish Patterns Trigger?
Stocks

Analyzing SIL, USO, and NVDA: Could These Bullish Patterns Trigger?

May 30, 2025
Next Post
MicroStrategy Raises $563M via Preferred Stock for Bitcoin

MicroStrategy Raises $563M via Preferred Stock for Bitcoin

Recommended

The chocolate man

The chocolate man

December 4, 2024
When Accountability Fades: The Toxic Reality Facing Bramley and Beyond

When Accountability Fades: The Toxic Reality Facing Bramley and Beyond

September 20, 2024
Starbucks (SBUX) Stock Analysis: Key Resistance at $103.33

Starbucks (SBUX) Stock Analysis: Key Resistance at $103.33

January 8, 2025
Pangilinan-led Smart targets broader 5G adoption with launch of low-cost 5G phone

Pangilinan-led Smart targets broader 5G adoption with launch of low-cost 5G phone

August 22, 2024
Gov’t to consider new taxes if revenue collection falls short — Recto

Gov’t to consider new taxes if revenue collection falls short — Recto

August 6, 2024
A definitive MICE guide to Astoria Hotels and Resorts conference halls and venues

A definitive MICE guide to Astoria Hotels and Resorts conference halls and venues

September 3, 2024

    Stay updated with the latest news, exclusive offers, and special promotions. Sign up now and be the first to know! As a member, you'll receive curated content, insider tips, and invitations to exclusive events. Don't miss out on being part of something special.


    By opting in you agree to receive emails from us and our affiliates. Your information is secure and your privacy is protected.

    • About us
    • Contact us
    • Privacy Policy
    • Terms & Conditions

    Copyright © 2025 InvestDailyPro. All Rights Reserved.

    Disclaimer: InvestDailyPro.com, its managers, its employees, and assigns (collectively InvestDailyPro ) do not make any guarantee or warranty about what is advertised above. Information provided by this website is for research purposes only and should not be considered as personalized financial advice.
    The Company is not affiliated with, nor does it receive compensation from, any specific security. The Company is not registered or licensed by any governing body in any jurisdiction to give investing advice or provide investment recommendation. Any investments recommended here should be taken into consideration only after consulting with your investment advisor and after reviewing the prospectus or financial statements of the company.

    No Result
    View All Result
    • About us
    • Contact us
    • Home
    • Privacy Policy
    • Suspicious engagement
    • Terms & Conditions
    • Terms & Conditions
    • Thank you

    Copyright © 2024 investdailypro.com | All Rights Reserved