With the market selling off into the close today, it’s too early to write my usual “best five sectors” article. The risk of ranking changes is too high. I will make sure that an update will be posted before the markets open on Monday.
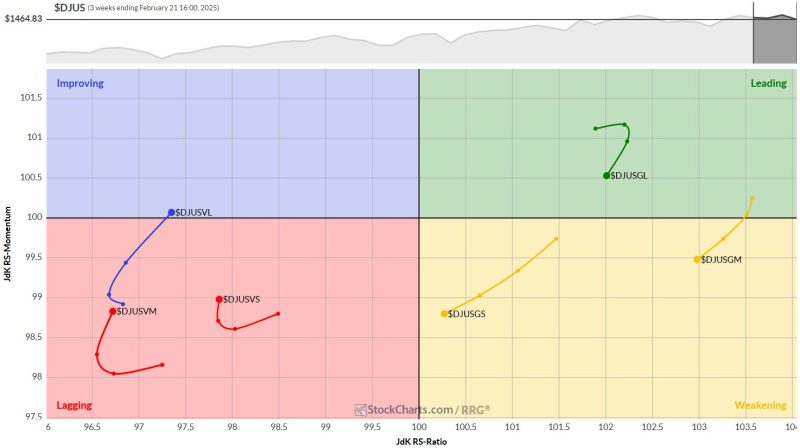
Instead, I want to build on this week’s RRG video analysis, where I examined the current strength of commodities and looked at growth, value, and size rotation.
You can see that video here.
Rotation Signals Commodities Springing Back to Life!
The synopsis of that analysis? Large-cap growth stocks are once again the preferred segment of the market. This underscores what’s happening right now — when the market is under pressure, investors usually flock to large-cap stocks. They’re familiar and supposedly less risky.
Cap-weighted vs Equal weight Sectors
Let’s dive deeper by comparing cap-weighted sectors with their equal-weighted counterparts. The two RRGs above illustrate these relationships. At first glance, most tails move in similar directions, though not necessarily in the same areas or quadrants. However, two sectors stand out in terms of divergent behavior: Staples and Financials.
RSPS (equal-weight Staples) has a short, southward-pointing tail inside the improving quadrant. On the other hand, XLP (cap-weighted Staples) is in the lagging quadrant but is picking up steam. For Financials, RSPF (equal-weight) weakens with a negative heading, while XLF (cap-weighted) rotates back towards the leading quadrant.
Cap-weighted vs Equal weight sectors on RRG
To simplify this analysis, I’ve created an RRG directly comparing cap-weighted to equal-weighted ETFs. This makes the trends crystal clear — cap-weighted sectors (dominated by large caps) are mostly moving with positive headings on the left side of the graph, either lagging or improving.
As our inputs are already ratios, we only want to know if that ratio is improving or deteriorating, so we use $one as the benchmark.
The Exceptions
There are a few notable exceptions to this trend:
Consumer Discretionary: A long tail moving from leading into weakening indicating.
Communication Services: Inside the leading quadrant but rolling over.
Technology: Just moved from leading to weakening.
For all three sectors, the dominant position of the larger names (mega caps) is fading and sector breadth is expanding.
These exceptions are particularly interesting because they represent some of the largest sectors in the market.
Large Cap vs Small Cap
Large- vs Small-Cap comparison on RRG
A similar exercise comparing large-cap and small-cap sectors reinforces the overall trend—large caps are generally outperforming. This comparison is even clearer, as these are real market CAO comparisons. In the first comparison above, there is only a weighting difference; all the stocks in these sectors are the same.
In this comparison, the constituents for the sectors are not the same, and they show the true difference between large- and small-cap stocks.
The only sector where small caps are about to take over is in Consumer Discretionary where we see a tail moving from leading towards, and almost crossing over into, weakening.
This aligns with the risk-off sentiment we’re seeing in the broader market.
S&P 500 Chart Analysis
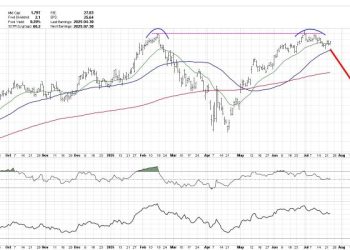
To summarize, let’s examine the SPY chart. After hovering around this level for a few days, the market has tried—and failed—to break above 610 decisively. Friday saw a big down day, closing below the rising support line. This suggests more weakness ahead and underscores the expectation that the S&P 500 needs time to digest within a trading range.
What does that range look like? In my opinion, we’re probably looking at a lower boundary between 580 and 585 and an upper boundary between 610 and 615. The weekly chart still shows an intact uptrend, but it’s clear we need some sideways or corrective price action to digest the gains of the last year (or year and a half, depending on where you anchor the rally’s start).
The Big Picture
All in all, the overall uptrend in the S&P 500 remains intact. However, we need a bit more sideways or corrective price action to digest recent gains. Large caps generally outperform, with some interesting exceptions in mega-cap-dominated sectors.
As always in markets, it’s all relative — and right now, the relative strength favors the big boys.
#StayAlert and have a great weekend. –Julius


