In the later stages of a bull market cycle, we will often observe a proliferation of bearish momentum divergences. As prices continue higher, the momentum underneath the advance begins to wane, representing an exhaustion of buyers.
We’ve identified a series of bearish momentum divergences in the early days of 2025, from Magnificent 7 names like Alphabet (GOOGL) to financial institutions including Synchrony Financial (SYF). Today, we’ll focus in on the bearish momentum divergence for Amazon.com (AMZN), which could indicate broader signs of weakness for the consumer discretionary sector as well as for the equity markets as a whole.
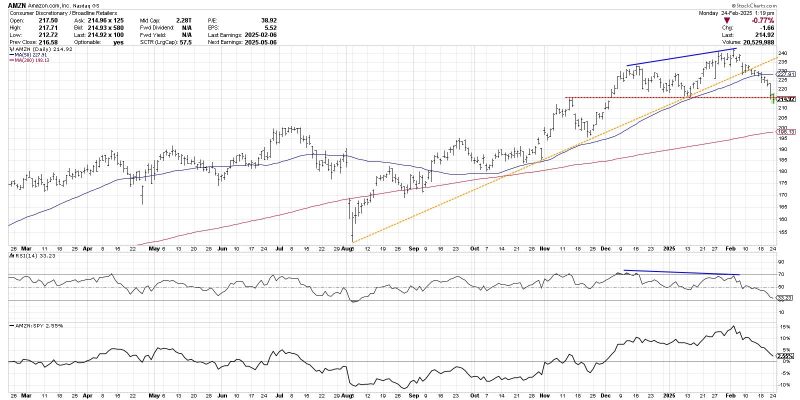
The daily chart of AMZN features all the key features of a bearish momentum divergence. Note how the price has remained in a primary uptrend going into this week, marked by a clear pattern of higher highs and higher lows. The most recent all-time high, achieved earlier this month when AMZN pushed briefly above the $240 level, saw the RSI fail to get above the overbought threshold.
The Magnificent 7 have transformed into the Meager 7. So which sectors or stocks might take the lead in 2025? Join me in our upcoming FREE webcast on Wednesday 2/26 at 1:00pm ET as we explore sector rotation trends, analyze growth vs. value dynamics, and spotlight stocks gaining momentum in Q1. Can’t make it live? No worries! Just register and I’ll send you the replay as soon as it’s ready. Sign up for Finding Value: The Great Rotation of 2025 today!
In a healthy bullish trend, we would expect higher price highs to be supported by strong momentum readings, indicating an influx of buying power and investor optimism. When new highs are matched with lower RSI levels, that suggests a lack of buying power and evaporating investor optimism.
Once a bearish momentum divergence is confirmed, we can monitor the most recent swing low to confirm a potential breakdown as the price follows through after the divergence. After reaching that support level around $215 last Friday, we have seen AMZN push below this support level during the trading day on Monday. A confirmed close below this support level could represent a meaningful breakdown and a “change of character” for one of the top weights in the Consumer Discretionary Select Sector SPDR Fund (XLY).
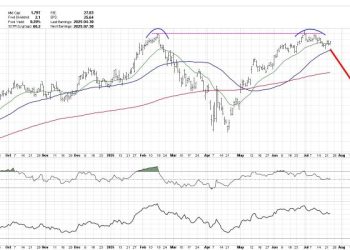
Any time I see a potential pattern on the daily chart, I remember the classic market maxim, “When in doubt, zoom out!” The weekly chart shows how the most significant pullbacks in 2023-2024 were marked by a sell signal from the weekly PPO indicator.
Over the last two weeks, we’ve recognized a similar bearish pattern to those previous pullbacks, both of which ended with AMZN finding support at the 40-week moving average. That would align closely with the 200-day moving average on the daily chart, which currently sits just below the $200 level.
When I see a bearish momentum divergence appear on a chart like Amazon, I’ve learned to put that chart on a ChartList of potential reversal names, and monitor those tickers for signs of a breakdown of support. Based on our analysis of the daily and weekly charts of AMZN, this leading internet retailer could be signaling a key breakdown going into March.
RR#6,
Dave
P.S. Ready to upgrade your investment process? Check out my free behavioral investing course!
David Keller, CMT
President and Chief Strategist
Sierra Alpha Research LLC
Disclaimer: This blog is for educational purposes only and should not be construed as financial advice. The ideas and strategies should never be used without first assessing your own personal and financial situation, or without consulting a financial professional.
The author does not have a position in mentioned securities at the time of publication. Any opinions expressed herein are solely those of the author and do not in any way represent the views or opinions of any other person or entity.


