
“The trend is your friend, until the end when it bends.”
How often have you heard this adage? More importantly, how often do you follow it?
Chasing stocks, whether it’s one that was texted to you as the next high-flying AI stock, a popular meme stock, or the next hot IPO, can be tempting. If you’re lucky, the price moves in your favor, you get elated, and you throw one heck of a party. Alas, the story doesn’t always end this way. The stock market can catch you off guard. It gives you several opportunities, but also unexpectedly robs them from you. This is especially true during an overextended market.
Any negative news headlines make investors nervous, leading them to make irrational decisions. To avoid falling into the trap of buying and selling stocks at the wrong time, take the smart approach and set some basic rules to follow.
Rule 1: Determine the Market’s Long-term Trend
You want to trade in the direction of the long-term trend—buy when the trend is up and sell when it is down. Buying stocks when the overall trend is declining can be like catching a falling knife, while selling stocks when the trend is rising could mean missing sizable moves. To determine the overall direction of the stock market’s long-term trend, look at a chart of a benchmark index, such as the S&P 500 ($SPX), that covers at least one year.
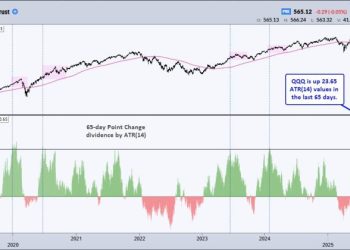
We’ll examine the weekly chart of the S&P 500 (see below). Overall, the index has trended higher for the last five years, but there have been pullbacks, some longer and more severe than others (pink shaded areas). The index is going through a pullback now, although we won’t know the magnitude of it until it’s over.
FIGURE 1. WEEKLY CHART OF THE S&P 500. Overall, the trend in the benchmark has been bullish, although there have been periods of declines and pullbacks. The index is going through a decline.Chart source: StockCharts.com. For educational purposes.
From January 2022 to October 2022, the S&P 500 declined over 20%. Many Wall Street analysts expected the decline to continue, but the S&P 500 recovered, ending 2023 with a 26.3% gain and 2024 with a 23.31% gain. There were a few minor pullbacks along the way, some more pronounced than others (end of 2023 and July to August 2024).
Nobody knows what the market will do, but, when you see a pullback forming—and it looks like one is forming—don’t plan on opening long positions. If you’re not convinced the market is pulling back, view a daily chart of the S&P 500 to see if it aligns with the weekly chart’s trend. If both indicate a downtrend or the two don’t align, you need to dig deeper.
Rule 2: Is Market Breadth Expanding or Contracting?
Market breadth is an effective method to uncover the percentage of stocks participating in the uptrend. The Bullish Percent Index (BPI) is one of several breadth indicators available in StockCharts and is available for indexes, sectors, and industry groups.
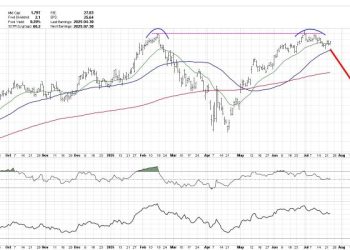
The chart below displays the BPI for the S&P 500 in the upper panel ($BPSPX) against the daily chart of the S&P 500 in the lower panel. When the BPI is above 50%, it indicates the bulls have an edge. When it’s below 50%, the bears have an edge.
FIGURE 2. DAILY CHART OF S&P 500 BULLISH PERCENT INDEX VS. S&P 500. Note the uptrends in the S&P 500 coincide with a BPI greater than 50. The downtrend in the S&P 500 coincides with an S&P 500 BPI of less than 50.Chart source: StockCharts.com. For educational purposes.
In the last year, besides the pullback periods in the S&P 500, the bulls have had the upper hand. If you wanted to invest in an S&P 500 stock when the bulls were in control, your first task is to find one that aligns with the bullish move.
Rule 3: Buy on Up Days, Sell on Down Days
Let’s focus on the period between August 9, 2024, and December 18, 2024, to coincide with the period when the BPI was greater than 50 and examine a hollow candlestick chart of Apple, Inc. (AAPL), one of the top cap-weighted stocks in the S&P 500.
FIGURE 3. DAILY CHART OF APPLE STOCK. From August 9 to December 18, 2024, which coincides with the S&P 500 BPI > 50, the stock price trended higher, displaying a series of hollow green candles at the front and tail end of the period.Chart source: StockCharts.com. For educational purposes.
Hollow candlestick charts are visually interesting and have the advantage of identifying a trend quickly. The upward movement began a few days before August 9, when there was a significant gap down in AAPL’s price. Even though it was a down day, the bar was hollow, which means the close was higher than the open.
Looking at all three charts, August 9 presented an opportune buy signal. It aligned with the bullish BPI and the long-term trend in the weekly and daily charts.
If you had hypothetically opened a long position, you could have exited your position on December 18, when the BPI turned bearish and made a decent return. You could have held on for a few more days, but the stock sold off quickly, so your exit would depend on how well your sell order got filled.
Regardless, you should have exited the position during the series of down days that started on December 27. If you hadn’t closed your position then and were still holding on to it, you would have been caught in the downward spiral that started when the S&P 500 BPI fell below 50 on February 27.
StockCharts Tip
Hollow candlestick charts differ from the traditional filled candlestick charts. To apply hollow candle charts, click the Hollow Candles button under Chart Attributes.
The Bottom Line
Given the erratic nature of the stock market, especially an over-extended one, a smart approach to investing requires following a set of rules. It doesn’t have to be complicated.
Identifying the long-term trend, checking the market’s breadth, and ensuring the trend of a stock you want to buy aligns with the overall market is a simple approach, but applying it successfully in real time takes practice. Practice applying the rules using a simulated account. There’s no better teacher than yourself.
Disclaimer: This blog is for educational purposes only and should not be construed as financial advice. The ideas and strategies should never be used without first assessing your own personal and financial situation, or without consulting a financial professional.


