
Tariff turmoil continues sending the stock market into a turbulent spin. Tariffs went into effect at midnight, which sent equities and bond prices lower. Then before 1:30 PM ET Wednesday, President Trump announced that China would be slapped with 125% tariffs and the reciprocal tariffs are on pause for 90 days.
This was a huge turning point for the market. Without skipping a heartbeat, buyers rushed in and accumulated equities, especially large-cap growth stocks. The S&P 500 closed higher by 9.52%, the Nasdaq was up 12.16%, and the Dow was up 7.87%. Small and mid-cap stocks also saw substantial gains.
Wednesday’s turnaround may have been the biggest one-day point gains in history for some of the broader stock market indexes but let’s look at the charts to see a clearer picture of what’s going on with this whacky stock market.
A View of the Broader Stock Market
From a long-term perspective, the uptrend in the S&P 500, Nasdaq, and Dow are still intact. The weekly charts of the three indexes are also encouraging. But the daily charts are not yet screaming buy signals. Let’s start with the daily chart of the Nasdaq.
FIGURE 1. DAILY CHART OF NASDAQ COMPOSITE. The index has hit the resistance of its 21-day exponential moving average and breadth indicators in the lower panels show some breadth indicators are improving but not enough to suggest a bottom in the index.Chart source: StockCharts.com. For educational purposes.
The Nasdaq touched its 21-day exponential moving average (EMA), which could be the first resistance level for it to overcome. The three breadth indicators in the lower panels—Nasdaq Composite Bullish Percent Index (BPI), NASDAQ Advance-Decline Line, and percentage of stocks trading above the 200-day moving average of the Nasdaq—are improving slightly but they are not showing signs of bullishness.
Wednesday’s best-performing S&P sector was Technology followed by Consumer Discretionary. Rotation into these sectors implies risk-on investing. However, since the Nasdaq’s daily trend is still down, don’t let your emotions guide your investment decisions. Look for confirming signals before entering any long positions.
The S&P 500 daily chart is not much different (see below). The index came close to touching its 21-day EMA. If the index opens higher on Thursday, watch this EMA closely. A break above it would be a positive move but there still needs to be a series of higher highs and higher lows for an uptrend to be established.
FIGURE 2. DAILY CHART OF THE S&P 500 INDEX. It’s worth watching the 21-day EMA in the S&P 500. If the index breaks through that level and starts showing signs of an uptrend and the market breadth indicators suggest increasing bullish participation, it may be time to think about adding positions. But, we’re far from that point. Chart source: StockCharts.com. For educational purposes.
The market breadth indicators in the lower panels are showing some signs of improvement. The percentage of stocks trading above the 200-day moving average of the S&P 500 is at 31.80, which is encouraging but you want to see it at or above 50%. Like the Nasdaq, the S&P 500 is showing no clear signs of an uptrend, so tread carefully.
Replace the symbol in either of the above charts with $INDU and you’ll see that the Dow is in a similar position as the Nasdaq and S&P 500.
Bonds to the Rescue?
Although equities showed a lot of movement on Wednesday, don’t lose sight of the shenanigans in the bond world. The 10-year U.S. Treasury yields rose as high as 4.47% but pulled back and closed at 4.40%, which is still relatively high. The iShares 20+ Year Treasury Bond ETF (TLT) closed 3.24% higher.
This price action in TLT is worth watching closely. Bond prices fall when yields rise and Wednesday started out with stock and bond prices falling. This is unusual since bond prices usually rise when stocks fall. There was a lot of bond selling taking place the previous night which may have been due to the unwind of the basis trade by hedge funds. Since we’re technical analysts, instead of getting into the nitty gritty details of this hedge fund strategy, let’s analyze the five-year weekly chart of TLT.
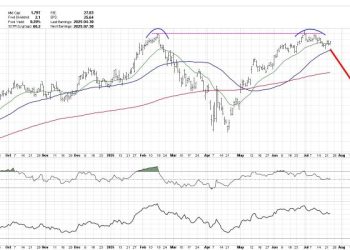
FIGURE 3. FIVE-YEAR WEEKLY CHART OF TLT. This bond ETF has been in a downward trend for the last five years. Has its time come or will it linger in the depths of the abyss for longer? Chart source: StockCharts.com. For educational purposes.
Bond prices have been trending lower over the past five years and showing no signs of a reversal. Although TLT came off its lows, it still has a long way to go before showing modest signs of an uptrend.
The Bottom Line
Wednesday’s big turnaround didn’t change the big picture. We’re not out of the woods yet. And there’s more excitement to look forward to — the March CPI on Thursday morning and earnings season kicks off on Friday. A note about earnings — we probably won’t see much of an impact this quarter but keep your ear open for any chatter on how tariffs will affect profitability.
Disclaimer: This blog is for educational purposes only and should not be construed as financial advice. The ideas and strategies should never be used without first assessing your own personal and financial situation, or without consulting a financial professional.


