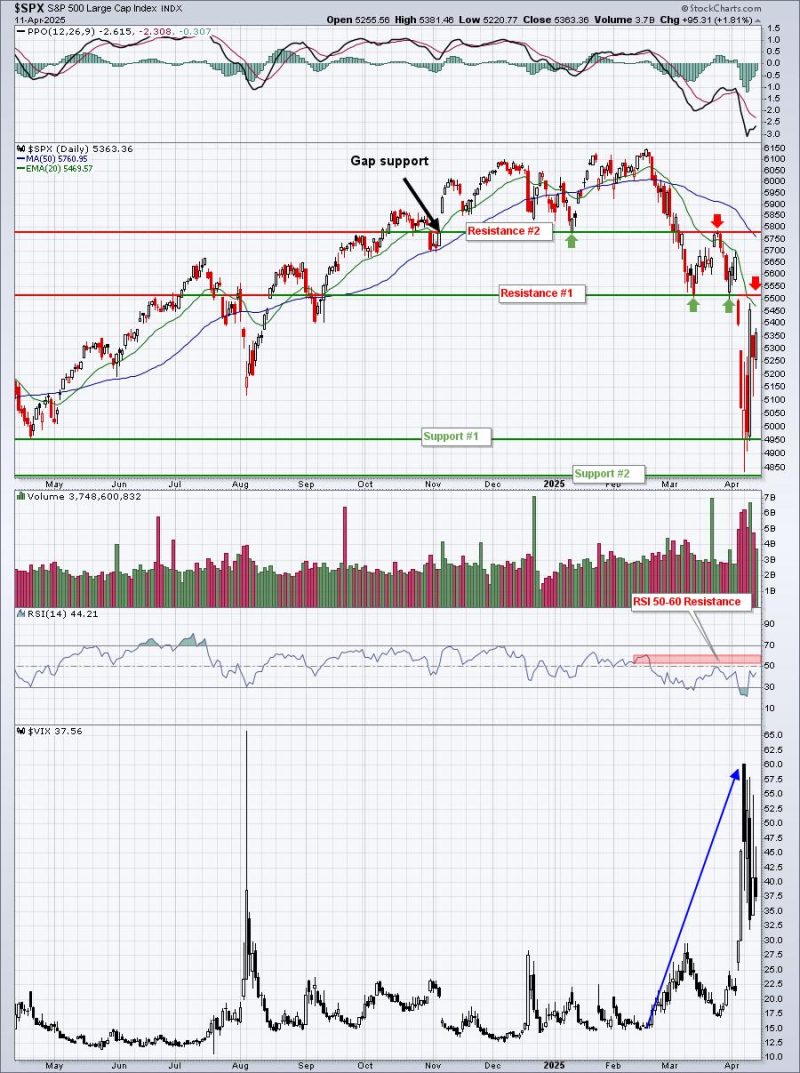
I pay attention to technical support levels as the combination of price support/resistance is always my primary stock market indicator. We’re in a downtrend and, in my opinion, the trading range is very, very clear on the S&P 500 right now:
I think most everyone can agree that much of the selling and fear and panic can be attributed the trade war – at least much of the weakness occurred with startling tariff news. So I figured I’d take a look at Q4 2018, which also experienced a 2-3 month bear market with the S&P 500 just barely reaching the prerequisite 20% drop. Here’s what that looked like:
The chart pattern during Q4 2018 was quite similar. The VIX more than tripled from under 12 to above 36. The VIX also more than tripled in 2025, after starting from a much higher level near 15. In both 2018 and 2025, that initial selling episode saw a drop of roughly 10% before consolidating. Then the next drop was another 10% or so. We don’t know if the selling for 2025 has ended, though, as that’s the wild card.
Here’s what we do know about sentiment. The VIX, with a value in the 50s, is signaling a potential S&P 500 bottom. Historically, surges in the VIX to this level or higher, have coincided either with stock market bottoms or they at least they suggest that any future selling in the S&P 500 is likely to be minor. Here’s a long-term monthly chart of the S&P 500 and the VIX, showing this relationship:
Extreme fear marks bottoms and I believe this is a great visual to support this belief. History tells us that when the VIX tops, we’ve either bottomed or we’re very close to bottoming.
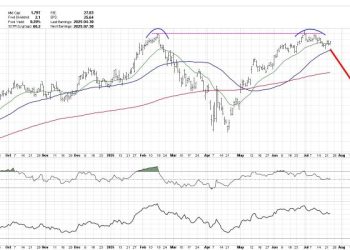
Late last week, we saw both the March Core CPI and March Core PPI come in well below expectations, which was a good result for those hoping for rate cuts to begin again later this year. On Friday, a lot of folks were talking very bearish after the University of Michigan consumer sentiment plummeted to a near 50-year low. The problem with that bearish line of thinking is that sentiment is a contrarian indicator. Bearish readings tend to be quite bullish for stocks, while bullish readings can mark significant tops. Don’t believe me? Check out this chart and then provide me your best bearish argument:
The low readings in the green-shaded areas are actually very bullish. You can’t argue with history and facts. When the general public is feeling despair, it’s the time to buy stocks, not sell. And for those who believe this time is different, let’s check back in one year from now and let’s see where we are.
Note one more thing. The absolute highest consumer sentiment reading was at the beginning of 2000, just before the dot com bubble burst. Everyone felt great back then and the S&P 500 didn’t make a meaningful new all-time high for 13 years. So you tell me, would you rather see sentiment strength or weakness?
I know it sounds awful to hear that consumer sentiment readings are among the lowest in history and it likely makes little sense to many why the stock market would go higher while sentiment is so negative. But you have to remember that the stock market looks 6-9 months ahead. It’s not concerned with the news coming out now. It’s much more concerned about what the market environment will look like later this year.
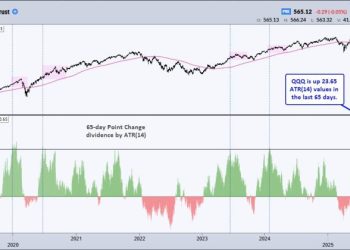
Here’s my last point for today. We’ve begun to see more bullish rotation among sectors and between growth and value. Let me show you one final chart that highlights the rotation into growth as the S&P 500 continues its descent:
Notice the S&P 500 made its final high in February as money rotated quickly from growth to value in the two months prior. That was Wall Street exiting the riskier areas of the market, when everything still looked fine. It was one of the many reasons why I turned cautious and moved to cash in late January. Now the opposite is occurring. The S&P 500 is downtrending and the news just keeps getting worse. Meanwhile, Wall Street is happily buying all the risky shares you’d like to sell.
Listen, I’ve been wrong before and maybe I’m wrong and the S&P 500 continues to decline throughout 2025. But I trust my review of the market and my signals that have worked so well for me in the past. I’m perfectly fine owning stocks right now.
Tomorrow morning, in our free EB Digest newsletter, I’ll be showing everyone the extreme manipulation that’s been taking place in the stock market the past 4 weeks or so. Market makers are stealing (legally) from all of us. I spotted this manipulation back in June 2022, which helped me to go against the grain and call the market bottom then and I’m seeing it again now. To learn more, be sure to CLICK HERE and sign up for our FREE EB Digest newsletter, if you haven’t already. There’s no credit card required and you may unsubscribe at any time.
Happy trading!
Tom


