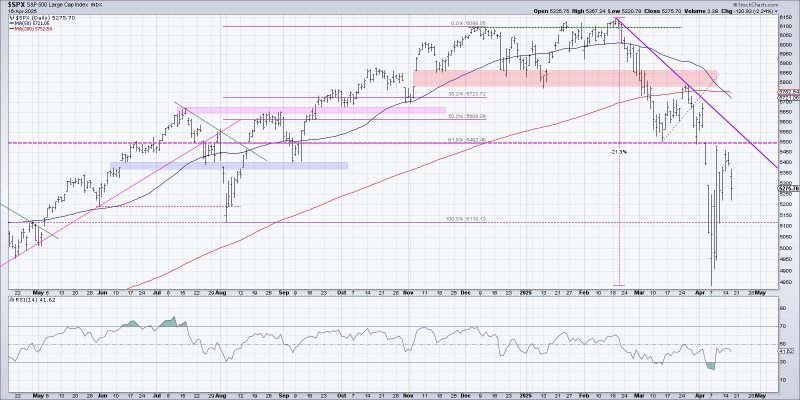
When markets get more volatile and more unstable, I get the urge to take a step back and reflect on simple assessments of trend and momentum. Today we’ll use one of the most common technical indicators, the 200-day moving average, and discuss what this simple trend-following tool can tell us about conditions for the S&P 500 index.
Nothing Good Happens Below the 200-Day Moving Average
I’ve received a number of questions recently as to why I’m not way more bullish after the sudden rally off last Wednesday’s low. I love to respond with Paul Tudor Jones’ famous quote, “Nothing good happens below the 200-day moving average.”
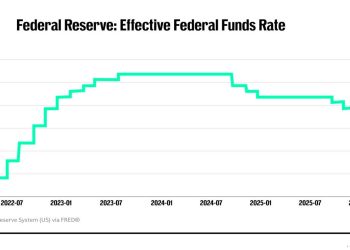
To be clear, the 200-day moving average is almost 500 points above current levels, so it would take quite a rally to achieve that price level any time soon. But with the VIX still well above the 30 level, that means the market is expecting wide price swings and big moves could be very possible.
But generally speaking, any time I see a chart where the price is below a downward-sloping 200-day moving average, I feel comfortable making the basic assumption that the primary trend is down. And until the SPX can regain this long-term trend barometer, I’m inclined to treat the market as “guilty until proven innocent.”
Tracking the 200-Day With the New Market Summary Page
The new and updated version of the StockCharts Market Summary page features a table of major equity indexes and includes a comparison to the 200-day moving average for each index. I’ve sorted today’s table in descending order based on this metric, which allows us to compare the relative position of different indexes and focus on which areas of the equity market are showing real strength.
We can see that only the Dow Utilities remain above the 200-day moving average, even with the strong bounce we’ve observed over the last week. The S&P 500 is about 8% below its 200-day moving average, and for the Nasdaq Composite it’s over 11%. So this basically implies that the S&P could see another 8% rally, drawing in all sorts of investors, yet still remain in a bearish phase based on its position relative to the 200-day.
Three Stocks Facing a Crucial Test This Week
One chart I’m watching closely this week involves three key growth stocks that are actually very near their own 200-day moving average. If these Magnificent 7 stocks have enough upside momentum to power through the 200-day, then there could definitely be hope for the S&P 500 and Nasdaq to follow suit in the coming weeks.
Note in the top panel how Meta Platforms (META) powered above the 200-day last Wednesday after the announcement of a 90-day pause in tariffs. But after closing above the 200-day for that one day, META broke right back below the next day. META has closed lower every trading day since that breakout.
Neither Amazon.com (AMZN) nor Tesla (TSLA) reached their own 200-day on last Wednesday’s rally, and both are now rapidly approaching their lows for 2025. And if mega cap growth stocks like META, AMZN, and TSLA are unable to power above their 200-day moving averages, why should we expect our growth-dominated benchmarks to do the same?
With a flurry of news headlines every trading day, and an earnings season that could paint a disturbing picture of lowered expectations for economic growth and consumer sentiment, I feel that there is more downside to be had before the great bear market of 2025 is completed. But instead of trying to predict the future, I choose to simply follow the trends. And based on the shape of the 200-day moving average for these important charts, the primary trend appears to still be down.
RR#6,
Dave
PS- Ready to upgrade your investment process? Check out my free behavioral investing course!
David Keller, CMT
President and Chief Strategist
Sierra Alpha Research LLC
Disclaimer: This blog is for educational purposes only and should not be construed as financial advice. The ideas and strategies should never be used without first assessing your own personal and financial situation, or without consulting a financial professional.
The author does not have a position in mentioned securities at the time of publication. Any opinions expressed herein are solely those of the author and do not in any way represent the views or opinions of any other person or entity.


