
It was another erratic week in the stock market. There were several market-moving events sprinkled throughout this short trading week, including earnings, escalation of tariff wars, and Chairman Jerome Powell’s remarks at the Economic Club of Chicago. This extended to wild swings in the bond market as well.
We had several positive earnings from banks and Netflix, Inc. (NFLX). Others, such as UnitedHealth Group, Inc. (UNH), disappointed, sending the Dow Jones Industrial Average ($INDU) lower by 1.33%.
Chairman Powell stated that tariffs could increase inflation. This would cause economic growth to slow down and unemployment to increase. The hope is that inflation is transitory, and, after it becomes stable, the Fed can continue to focus on its dual mandate of maximum employment and price stability.
It’s an insecure time for investors, and many feel the pain. You’re probably wondering how long this pain will go on for. In an uncertain environment, the best you can do is turn to the bond market.
It’s All About Bonds
The recent wild swinging market activity can be encapsulated in the price action of Treasury yields. Since 2024, yields have been swinging up and down. In the past year, the 10-year Treasury yield has ranged from 3.60% to 4.81%, and when the range is this wide, it’s an indication of economic instability. Not to mention, economic instability could result in a weaker economy.
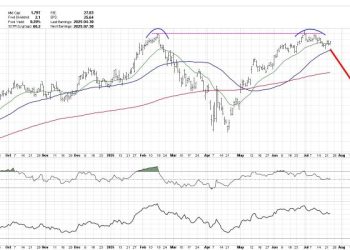
The daily chart of the 10-Year US Treasury Yield Index ($TNX) gives you an idea of the range of yields in the last year. More recently, the yield has risen from 3.89% to 4.59%, and has now pulled back to its 50-day simple moving average (SMA).
FIGURE 1. DAILY CHART OF 10-YEAR TREASURY YIELDS. Yields have been seeing some large up and down swings.Chart source: StockCharts.com. For educational purposes.
Generally, when stock prices fall, bond prices rise. Since bond yields move inversely to bond prices, you’d expect yields to fall. This scenario isn’t playing out. Instead, we’re seeing yields move erratically while bond prices remain suppressed. There needs to be stability in bond yields before a stock market recovery, and one way to do that is to monitor the chart of the Merrill Lynch Option Volatility Estimate, referred to as the MOVE Index ($MOVE).
The MOVE Index tracks bond volatility. Think of it as the bond counterpart to the Cboe Volatility Index ($VIX). The chart below displays the $MOVE/$VIX relationship, with the correlation between the two in the lower panel.
FIGURE 2. THE MOVE INDEX VS. VIX. A high correlation between the MOVE Index and VIX suggests interest rates and stock prices are tightly connected. A lower correlation would indicate stability in equities.Chart source: StockCharts.com. For educational purposes.
The two have been highly correlated since the end of March, which indicates that stocks and interest rates are tightly connected. This means the wild up and down swings in equities could continue. When the two are less correlated, we can expect equities to start settling down. Looking at the above chart, a correlation of 0.80 would be sufficient for signs of stability.
Both $VIX and $MOVE have come back slightly, but their correlation is at 0.93, which is relatively high.
Be sure to save both charts displayed in this article to your ChartLists. They could alert you to stability in the stock market ahead of other indicators.
The Bottom Line
Until stability returns, you could do the following:
- Stay on the sidelines and keep some dry powder.
- Invest in risk-off instruments such as gold and silver.
- Park some of your money in defensive sectors.
Equities could slide lower before stability returns. If this happens, you could pick up some growth stocks for a bargain.
An empowered investor comes out ahead after market instability. So monitor the market closely and, when the time is right, make wise investment decisions.
End-of-Week Wrap-Up
- S&P 500 down 1.50% on the week, at 5282.70, Dow Jones Industrial Average down 2.66% on the week at 39,142.23; Nasdaq Composite down 2.62% on the week at 16,286.45.
- $VIX down 21.06% on the week, closing at 29.65.
- Best performing sector for the week: Energy
- Worst performing sector for the week: Consumer Discretionary
- Top 5 Large Cap SCTR stocks: Palantir Technologies, Inc. (PLTR); Elbit Systems, Ltd. (ESLT); Anglogold Ashanti Ltd. (AU); Just Eat Takeaway.com (JTKWY); Kinross Gold Corp. (KGC)
On the Radar Next Week
- Earnings season continues with Haliburton (HAL), Tesla (TSLA), Boeing Co. (BA), International Business Machines (IBM) and others reporting.
- 30-Year Mortgage Rates
- March New Home Sales and Building Permits
- April S&P PMI
- April Consumer Sentiment
- Fed speeches from Jefferson, Harker, Kashkari, and others.
Disclaimer: This blog is for educational purposes only and should not be construed as financial advice. The ideas and strategies should never be used without first assessing your personal and financial situation, or without consulting a financial professional.


