The week that went by was a short trading week with just three trading days. However, the Indian equities continued to surge higher, demonstrating resilience, and the week ended on a positive note. In the week before this one, the Nifty was able to defend the 100-week MA; last week, it surged higher and closed just at the 50-week MA. The trading range got narrower; the Index oscillated in a 665.35-point range. The volatility, too, cooled off; the India Vix declined by 23.08% to 15.47. While staying largely stable with a strong underlying bias, the headline Index closed with a net weekly gain of 1023.10 points (+4.48%).
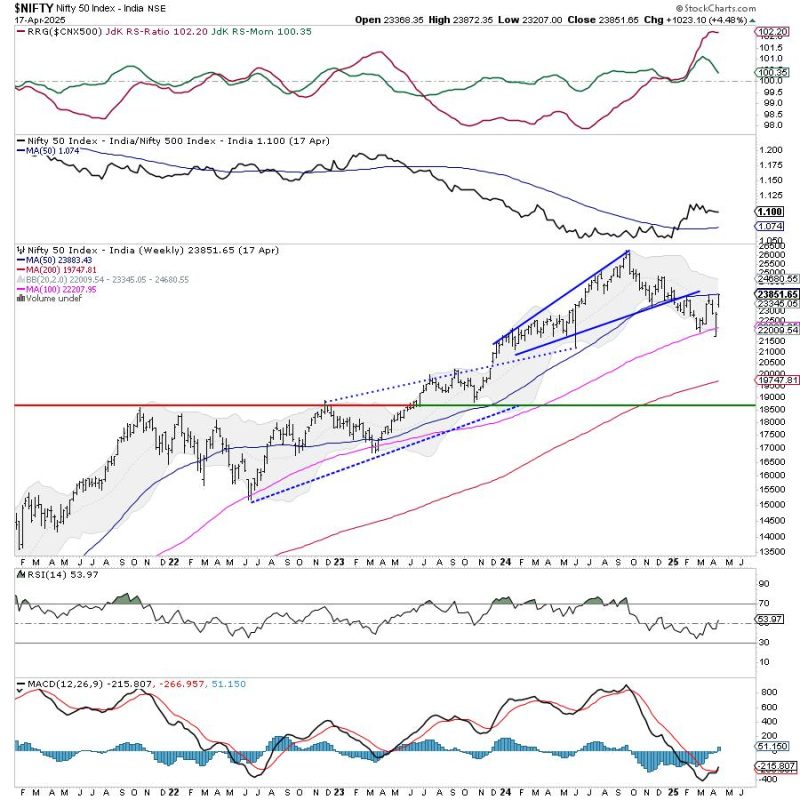
There are a few technical levels that need to be closely observed. The Nifty resisted the 100-day moving average (DMA) at 23395 before breaking out above that level. Zooming out to the weekly chart, the Nifty has closed at the 50-week MA, currently placed at 23885. This point and the 200-DMA at 24050 create an important resistance zone for the Nifty. While there is room for Nifty to move higher towards the 24000 level, there are strong possibilities of the markets consolidating between the 23900 and 24000 levels. While no major drawdowns are expected, there is a high chance that the upmove may at least take a breather around this level. It is important to watch Nifty’s behavior against this level.
The coming week may start on a stable note; the levels of 24,000 and 24,210 are likely to act as resistance points. The support will come lower at 23500 and then at 23345, which is the 20-week MA.
The weekly RSI is 53.94; it has formed a 14-period high, indicating a bullish trend. The weekly MACD has shown a positive crossover; it is now bullish and trades above its signal line.
The pattern analysis on the weekly chart shows that the Nifty has returned to the important level of the 50-week moving average, which it previously violated when it initiated its corrective move. This level and the 200-DMA placed at a short distance at 24050 are likely to offer resistance. This would mean that the markets are entering a major resistance zone; unless 24050 is taken out on the upside, we can expect the markets to consolidate, showing minor retracements over the coming days.
Overall, it is time for one to focus on protecting the gains at higher levels. While one may continue staying invested on the long side, new purchases must focus on the pockets that have shown the improvement of relative strength at lower levels and show strong signs of reversing their trend. Effective rotation into sectors that show improvement in their relative strength and protecting gains in the pockets that have run up hard would be important. A cautiously positive outlook is advised for the coming week.
Sector Analysis for the coming week
In our look at Relative Rotation Graphs®, we compared various sectors against CNX500 (NIFTY 500 Index), which represents over 95% of the free float market cap of all the stocks listed.
Relative Rotation Graphs (RRG) show the Nifty PSU Bank and Consumption sector Index has rolled inside the leading quadrant. The Commodities, Financial Services, Banknifty, Infrastructure, and Metal Index are also placed inside the leading quadrant. While the Metal Index is showing a weakening of relative momentum, these groups are likely to relatively outperform the broader Nifty 500 index.
There are no sectors inside the weakening quadrant.
The Pharma Sector Index has rolled inside the lagging quadrant. The IT index also continues to languish inside this quadrant, along with the Midcap 100 index. The Realty and the Media Indices are also inside the lagging quadrant; however, they are seen sharply improving their relative momentum against the broader markets.
The Nifty PSE, Energy, and FMCG Indices are inside the improving quadrant; they are expected to continue improving on their relative performance over the coming week.
Important Note: RRG charts show the relative strength and momentum of a group of stocks. In the above Chart, they show relative performance against NIFTY500 Index (Broader Markets) and should not be used directly as buy or sell signals.
Milan Vaishnav, CMT, MSTA
Consulting Technical Analyst


