We’ve been cautious about the uptrend phase off the April low for a number of reasons, including the lack of breadth support. While short-term measures of breadth had turned more positive, the long-term breadth conditions had remained firmly in the bearish realm. With the renewed strength in risk assets over the last week, our long-term breadth measures now indicate a healthy uptrend phase.
Today we’ll dive a little deeper into one of those breadth indicators, talk about why we track moving average breadth, and show how this recent bullish signal could be a sign of stronger price action to come.
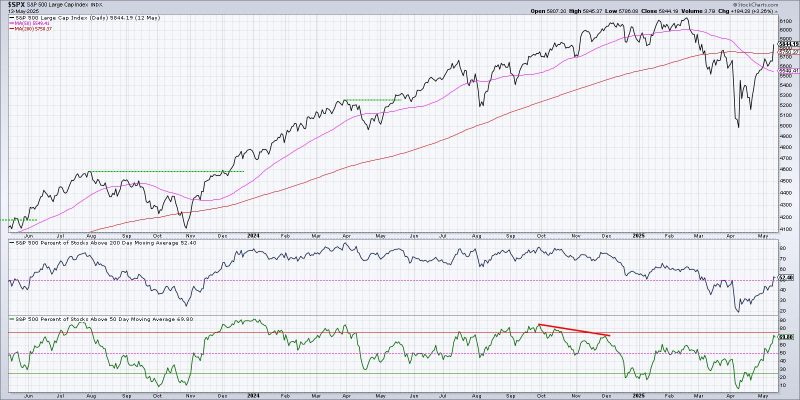
Here we’re showing the S&P 500 on a closing basis along with its 50-day and 200-day moving averages. Below that, we’re tracking the percent of S&P 500 stocks above their 200-day moving average, followed by the percent of stocks above their 50-day moving average.
Starting at the bottom, we can see that less than 10% of S&P 500 members were above their 50-day moving average at the April 2025 low. The last time we had reached below the 10% level was back in October 2023, just before a significant market bottom.
While the surge in this short-term breadth indicator over the last month has suggested a tactical rally, the panel above shows how there were still less than 50% of S&P 500 members above their 200-day moving average. So most stocks had regained the short-term moving average, but were still languishing below the long-term moving average.
As risk assets have surged higher this week, it’s meant enough upside momentum that now most S&P 500 members are back above their 200-day moving average. Now let’s look at a longer-term time frame and consider previous instances where this long-term moving average breadth indicator has gone from below 25% to above 50%.
We’ve identified eight occurrences of this pattern since the 2009 market low. In all eight occurrences, the S&P 500 has experienced positive returns in the next 12 months. And with the exception of the signal in October 2015, we haven’t seen any retest of the previous swing low.
Let’s dig into that 2015 example a little further, and you’ll see what differentiated that particular signal from all the others.
In all the other occurrences, the S&P 500 broke above its 200-day moving average and held that crucial level of support. In Q4 2015, however, the S&P 500 failed to hold the 200-day moving average, and the breadth indicators soon rotated back to a bearish phase.
It took another attempt in March 2016 before the chart finally resolved to the upside, with the S&P 500 leaving the 200-day moving average behind as it continued to push higher. Breadth indicators continued to improve as investors began to believe in the bull market of 2016.
I was taught that “nothing good happens below the 200-day moving average,” which also implies that good things can definitely happen above this long-term trend barometer. At this point, given the bullish breadth rotation that we’ve observed off the April low, I would say that as long as the S&P 500 remains above its 200-day moving average, then we stand a serious chance of further upside from here.
If, however, the SPX fails to hold this crucial line of support, and the index falls back below the 5750 level, then we may be looking at more of a 2015-style retracement as fears rise and stocks drop.
RR#6,
Dave
PS- Ready to upgrade your investment process? Check out my free behavioral investing course!
David Keller, CMT
President and Chief Strategist
Sierra Alpha Research LLC
https://www.youtube.com/c/MarketMisbehavior
Disclaimer: This blog is for educational purposes only and should not be construed as financial advice. The ideas and strategies should never be used without first assessing your own personal and financial situation, or without consulting a financial professional.
The author does not have a position in mentioned securities at the time of publication. Any opinions expressed herein are solely those of the author and do not in any way represent the views or opinions of any other person or entity.


