The S&P 500 ($SPX) just staged one of the sharpest rebounds we’ve seen in years. After tumbling into deeply oversold territory earlier this year, the index has completely flipped the script—short-term, medium-term, and even long-term indicators are now pointing in a new direction.
One longer-term indicator that hit an extreme low in early April was the 14-week relative strength index (RSI), which dropped to 27. That’s among the lowest levels since the 2008 financial crisis.
The obvious takeaway: it was a great time to buy, even in cases where the low RSI didn’t mark the low. Everyone who pounded the table a few weeks ago has been proven right, even if the rebound was faster and stronger than most could’ve predicted. So, what happens next?
Don’t Expect a Straight Line Up
The long-term picture looks promising, but markets rarely move in a straight line. Even though the market was higher months and years after these deeply oversold readings, the path wasn’t a straight shot to new highs (even if long-term log charts sometimes make it look that way).
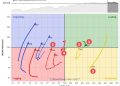
The chart below shows the lowest weekly RSI readings in the S&P 500 since 2008.
FIGURE 1. THE LOWEST WEEKLY RSI READING SIN THE S&P 500 SINCE 2008.
Almost every time, there was a pause, often more than one. Some were sharp, others more prolonged. The first real test typically came when RSI bounced back to the 50-zone (the mid-point of its range). Each of these moments is highlighted in yellow in the chart below.
FIGURE 2. AFTER DEEPLY OVERSOLD RSI READINGS, THERE WAS OFTEN A PAUSE IN THE INDEX.
As shown, this often marked the initial digestion phase after the face-ripping rally off the lows. Eventually, the SPX climbed back to a weekly overbought condition, but not right away. This pattern was clearest in 2011, 2015–16, and 2022. The depressed weekly RSI showed that things were getting washed out, but volatility persisted before a lasting uptrend took hold.
Indeed, the current snapback is one of the quickest and most powerful turnarounds in decades, but this pace is also unsustainable. A slowdown is inevitable.
So how does the market handle the next round of profit-taking? By continuing to make higher lows – and converting those into additional bullish patterns.
XLK Makes A Comeback
The market comeback has been led by large-cap growth; that much is clear. The Technology Select Sector SPDR ETF (XLK) has roared back nearly 30% in just six weeks. That’s a massive move in a short period, and far larger than any failed bear market rally seen in 2022. The best six-week rally back then came in the summer and topped out at 17%.
The last time we saw a six-week gain of 20%+ was the period following the COVID-19 low in spring 2020. As we know, that snapback continued, with XLK overtaking its pre-crash highs and ultimately rallying 160% into the early 2022 peak.
This isn’t a prediction, but we shouldn’t ignore it either. Why? Because before 2020, the last such move happened in April 2009, right after the ultimate low of the 2008 financial crisis.
FIGURE 3. WEEKLY CHART OF XLK.
Industrials are Building Strength Too
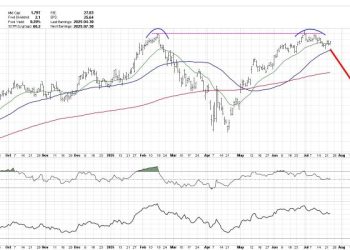
The Industrial Select Sector SPDR ETF (XLI) and XLK are the first sector ETFs to register overbought 14-day RSI readings. While that suggests a short-term pause could be near, it wouldn’t be a negative. As the weekly chart shows, a pullback could help complete a large bullish formation.
Once again, bouts of intense volatility eventually can lead to the biggest bullish chart formations. Let’s keep XLI on our radar screens.
FIGURE 4. WEEKLY CHART OF XLI.
Even Solar Stocks Are Waking Up
The Invesco Solar ETF (TAN), which has been stuck in a brutal downtrend for years, just rocketed higher by 40%, using intra-day highs and lows. That rally has produced the first overbought reading since late May 2024, which, notably, lasted only a day before momentum faded.
Yesterday, TAN tagged its 200-day moving average, prompting a round of profit-taking. This sets up a critical test for TAN, which has consistently failed at resistance or after short-term pops. Selling strength in TAN has been a highly effective strategy for quite some time.
FIGURE 5: DAILY CHART OF TAN.
The weekly chart clearly shows this pattern playing out since TAN topped in early 2021. Like anything else, TAN could eventually turn the corner—but to do so, it would need to form a legitimate higher low from here.
For now, the downtrend deserves respect. Chasing this move is not advised. Selling strength remains the recommended approach—until proven otherwise.
FIGURE 6. WEEKLY CHART OF TAN.
The Bottom Line
Yes, the market’s comeback has been fast and fierce. But fast moves don’t necessarily mean a straight path higher. Expect slowdowns and pullbacks, watch for bullish setups, and don’t chase runaway rallies. There’s opportunity out there, but it’s all about timing and discipline.


