With Friday’s pullback after a relatively strong week, the S&P 500 chart appears to be flashing a rare but powerful signal that is quite common at major market tops. The signal in question is a bearish momentum divergence, formed by a pattern of higher highs in price combined with lower peaks in momentum, which indicates weakening buying power after an extended bullish phase.
Today, we’ll share a brief history lesson of previous market tops starting with the COVID peak in 2020. And while we don’t necessarily see a sudden downdraft as the most likely outcome, this bearish price and momentum structure suggests limited upside for the S&P 500 until and unless this divergence is invalidated.
First, let’s review some classic market tops, see how divergences are formed, and learn what often comes next.
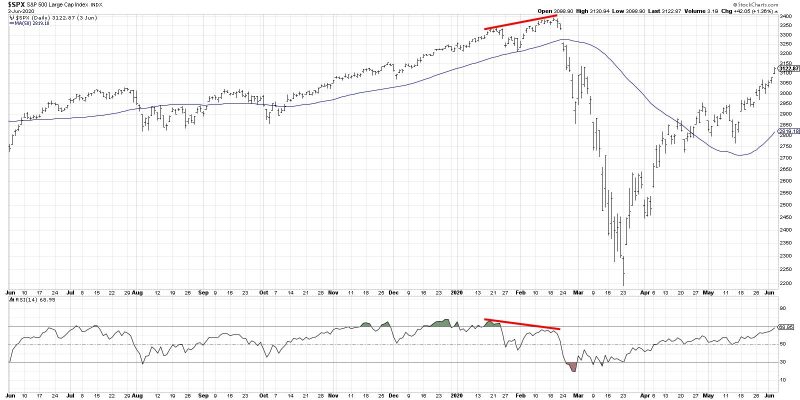
The year 2020 started in a position of strength, continuing the uptrend phase of 2019. But conditions soon deteriorated, with weaker momentum and breadth signals flashing cautionary patterns. In the chart below, we can see the higher highs and higher lows in price action in January and February 2020.
Notice how the RSI was overbought at the January peak but not overbought at the February top? This pattern of higher prices on weaker momentum is what we’re looking for, as it implies a lack of buying power and therefore limited upside.
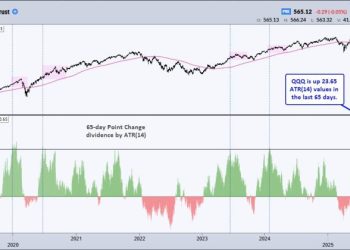
Almost two years later, the market had been driven higher due to an unprecedented amount of liquidity injected into the financial system. Toward the end of 2021, however, we saw the familiar bearish divergence flash again.
Here, we can see the higher price highs in November 2021 through January 2022 were marked by lower readings on momentum indicators like RSI. It’s worth noting here that these divergences don’t happen in a vacuum. In other words, we can use other tools in the technical analysis toolkit to evaluate the trend and determine if the price is reacting as expected to the bearish divergence.
In the weeks after the 2022 peak, we can see that the price broke down through an ascending 50-day moving average. The RSI eventually broke below the 40 level, confirming the rotation from a bullish phase to a bearish phase. So while the divergence itself does not imply a particular path in the months after the signal, it alerts us to use other indicators to validate and track a subsequent downtrend move.
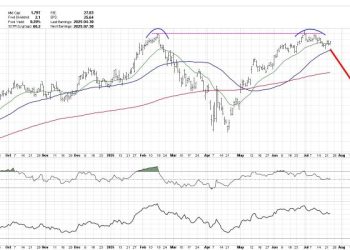
More recently, the February 2025 market peak featured some classic momentum patterns going into the eventual top.
Starting in August 2024, we can see a series of higher price highs that were accompanied by improving RSI peaks. As the price was moving higher, the stronger momentum readings confirmed the uptrend phase. Then, starting December 2024, the next couple price peaks were marked with weaker momentum readings. This bearish divergence with price and RSI once again signaled waning momentum going into a major market peak.
That brings us to the current S&P 500 chart, featuring yet another bearish momentum divergence. And based on what we’ve reviewed so far, you can probably understand why I’m a bit skeptical going into next week!
To be fair, I’ve highlighted price and momentum divergences from significant market tops, many of which came after extended bull market phases. In this case, we’re still only two months off a major market low. However, I would argue the basic premise still holds true. With Friday’s pullback, the S&P 500 appears to be flashing this same pattern of higher prices on weaker momentum. Considering this negative rotation on momentum, I would anticipate at least a retest of the May swing low around 5770.
What would change this tactical bearish expectation? The only way for a bearish divergence to be negated is for the price to continue higher on stronger momentum. So, until we see the price make a new peak combined with the RSI pushing back up to overbought levels, a pullback may be the most likely scenario in the coming weeks.
RR#6,
Dave
P.S. Ready to upgrade your investment process? Check out my free behavioral investing course!
David Keller, CMT
President and Chief Strategist
Sierra Alpha Research LLC
https://www.youtube.com/c/MarketMisbehavior
Disclaimer: This blog is for educational purposes only and should not be construed as financial advice. The ideas and strategies should never be used without first assessing your own personal and financial situation, or without consulting a financial professional.
The author does not have a position in mentioned securities at the time of publication. Any opinions expressed herein are solely those of the author and do not in any way represent the views or opinions of any other person or entity.


