Invest Daily Pro
  • Economy
  • Investing
No Result
View All Result
  • Economy
  • Investing
No Result
View All Result
Invest Daily Pro
No Result
View All Result
Home Stocks

S&P 500 Breaking Out Again: What This Means for Your Portfolio

by Invest Daily Pro
July 25, 2025
in Stocks
0
S&P 500 Breaking Out Again: What This Means for Your Portfolio
0
SHARES
0
VIEWS
Share on FacebookShare on Twitter

The S&P 500 ($SPX) just logged its fifth straight trading box breakout, which means that, of the five trading ranges the index has experienced since the April lows, all have been resolved to the upside.

How much longer can this last? That’s been the biggest question since the massive April 9 rally. Instead of assuming the market is due to roll over, it’s been more productive to track price action and watch for potential changes along the way. So far, drawdowns have been minimal, and breakouts keep occurring. Nothing in the price action hints at a lasting change — yet.

While some are calling this rally “historic,” we have a recent precedent. Recall that from late 2023 through early 2024, the index had a strong start and gave way to a consistent, steady trend.

From late October 2023 through March 2024, the S&P 500 logged seven consecutive trading box breakouts. That streak finally paused with a pullback from late March to early April, which, as we now know, was only a temporary hiccup. Once the bid returned, the S&P 500 went right back to carving new boxes and climbing higher.

New 52-Week Highs Finally Picking Up

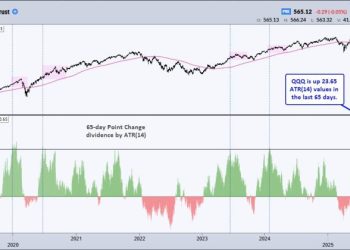
If there’s been one gripe about this rally, it’s that the number of new highs within the index has lagged. As we’ve discussed before, among all the internal breadth indicators available, new highs almost always lag — that’s normal. What we really want to see is whether the number of new highs begins to exceed prior peaks as the market continues to rise, which it has, as shown by the blue line in the chart below.

As of Wednesday’s close, 100 S&P 500 stocks were either at new 52-week highs or within 3% of them. That’s a strong base. We expect this number to continue rising as the market climbs, especially if positive earnings reactions persist across sectors.

Even when we get that first day with 100+ S&P 500 stocks making new 52-week highs, though, it might not be the best time to initiate new longs.

The above chart shows that much needs to align for that many stocks to peak in unison, which has historically led to at least a short-term consolidation, if not deeper pullbacks — as highlighted in yellow. Every time is different, of course, but this is something to keep an eye on in the coming weeks.

Trend Check: GoNoGo Still “Go”

The GoNoGo Trend remains in bullish mode, with the recent countertrend signals having yet to trigger a greater pullback.

Active Bullish Patterns

We still have two live bullish upside targets of 6,555 and 6,745, which could be with us for a while going forward. For the S&P 500 to get there, it will need to form new, smaller versions of the trading boxes.

Failed Bearish Patterns

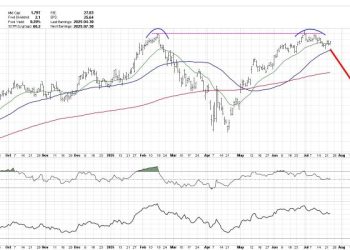
In the chart below, you can view a rising wedge pattern on the recent price action, the third since April. The prior two wedges broke down briefly and did not lead to a major downturn. The largest pullbacks in each case occurred after the S&P 500 dipped below the lower trendline of the pattern.

The deepest drawdown so far is 3.5%, which is not exactly a game-changer. Without downside follow-through, a classic bearish pattern simply can’t be formed, let alone be broken down from.

We’ll continue to monitor these formations as they develop because, at some point, that will change.

ShareTweetPin

Related Posts

Momentum Leaders Are Rotating — Here’s How to Find Them
Stocks

Momentum Leaders Are Rotating — Here’s How to Find Them

July 25, 2025
A Wild Ride For the History Books: 2025 Mid-Year Recap
Stocks

A Wild Ride For the History Books: 2025 Mid-Year Recap

July 24, 2025
Is META Breaking Out or Breaking Down?
Stocks

Is META Breaking Out or Breaking Down?

July 24, 2025
Tech Taps the Brakes, Homebuilders Hit the Gas: See the Rotation on StockCharts Today
Stocks

Tech Taps the Brakes, Homebuilders Hit the Gas: See the Rotation on StockCharts Today

July 23, 2025
Tech Taps the Brakes, Homebuilders Hit the Gas: See the Rotation on StockCharts Today
Stocks

Tech Taps the Brakes, Homebuilders Hit the Gas: See the Rotation on StockCharts Today

July 23, 2025
The Best Five Sectors, #28
Stocks

The Best Five Sectors, #28

July 21, 2025
Next Post
Momentum Leaders Are Rotating — Here’s How to Find Them

Momentum Leaders Are Rotating — Here’s How to Find Them

Recommended

Gold vs. Copper: Which Metal Will Shine Brighter in 2025?

Gold vs. Copper: Which Metal Will Shine Brighter in 2025?

March 11, 2025
The evolutionary benefits of being forgetful

The evolutionary benefits of being forgetful

November 7, 2024
How 4 Innovative Companies are Shaping the Future of Sustainability and Pioneering Change

How 4 Innovative Companies are Shaping the Future of Sustainability and Pioneering Change

October 26, 2024
Studio Ghibli founder and Bhutan’s first awardee among recipients of RMA

Studio Ghibli founder and Bhutan’s first awardee among recipients of RMA

August 31, 2024
Qpano: A Revolution in Real Estate Visualization and Marketing

Qpano: A Revolution in Real Estate Visualization and Marketing

November 25, 2024
Leon weakens to Typhoon status as it passes close to Orchid Islands, Taiwan—PAGASA

Leon weakens to Typhoon status as it passes close to Orchid Islands, Taiwan—PAGASA

October 31, 2024

    Stay updated with the latest news, exclusive offers, and special promotions. Sign up now and be the first to know! As a member, you'll receive curated content, insider tips, and invitations to exclusive events. Don't miss out on being part of something special.


    By opting in you agree to receive emails from us and our affiliates. Your information is secure and your privacy is protected.

    • About us
    • Contact us
    • Privacy Policy
    • Terms & Conditions

    Copyright © 2025 InvestDailyPro. All Rights Reserved.

    Disclaimer: InvestDailyPro.com, its managers, its employees, and assigns (collectively InvestDailyPro ) do not make any guarantee or warranty about what is advertised above. Information provided by this website is for research purposes only and should not be considered as personalized financial advice.
    The Company is not affiliated with, nor does it receive compensation from, any specific security. The Company is not registered or licensed by any governing body in any jurisdiction to give investing advice or provide investment recommendation. Any investments recommended here should be taken into consideration only after consulting with your investment advisor and after reviewing the prospectus or financial statements of the company.

    No Result
    View All Result
    • About us
    • Contact us
    • Home
    • Privacy Policy
    • Suspicious engagement
    • Terms & Conditions
    • Thank you

    Copyright © 2025 investdailypro.com | All Rights Reserved