To understand what makes the Dow Jones tick, you have to first understand one of the key differences between the Dow Jones and the S&P 500 indices. There are a few, but none more critical than the following:
Index Weighting
The S&P 500 is market-cap weighted, meaning that companies with the highest market capitalization have a stronger hand in moving the S&P 500 index value. Currently, these are the companies that play the largest role in moving this benchmark index, including their weighting:
- AAPL – 7.58%
- NVDA – 6.59%
- MSFT – 6.27%
- AMZN – 4.11%
- GOOGL – 4.02%
These are 5 of the Mag 7 stocks and they carry 28.57% of the entire weighting of the benchmark S&P 500 index. It’s easy to see how the S&P 500 can be swayed easily by the performance of just these 5 stocks.
Well, guess what? We need a cute lil name for the Top 5 price-weighted stocks in the Dow Jones, because their collective weight is 32.43% of the entire Dow Jones Industrial Average. The Dow Jones, by contrast, is a price-weighted index. The highest priced stock carries the most weight, while the lowest priced stock carries the least weight. Market capitalization plays NO role in the weighting. Want to know who the “Fabulous 5” are? Here ya go:
- GS – 8.25%
- UNH – 7.29%
- MSFT – 6.07%
- HD – 5.60%
- CAT – 5.22%
All 5 of these stocks now trade beneath their declining 20-day EMAs and only one (MSFT) still shows a 20-day EMA above its 50-day SMA. In other words, 4 of the 5 have experienced “death crosses”, which are bearish technical developments.
Looking at the RRG
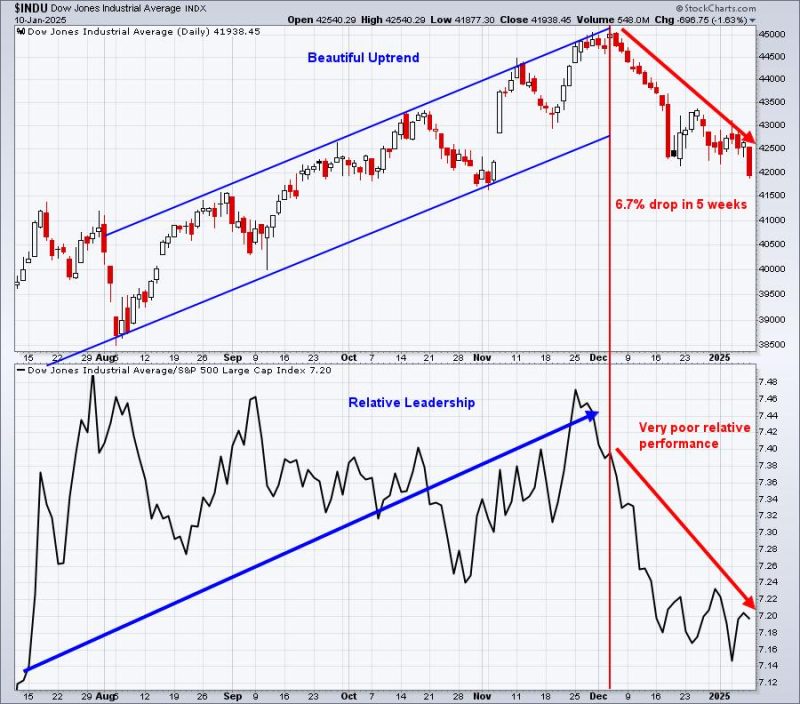
Here’s another way to look at the change that’s taken place within the Fabulous 5, just over the past 5-6 weeks. But before we do that, let’s first pull up the chart of the entire Dow Jones:
Heading into December, there was a solid uptrend on the Dow’s absolute chart and mostly sideways relative action after a very strong relative performance in July. Since early December, even late November, everything has headed south on the Dow Jones.
We can now take a look at an RRG as of early December to show how the Fab 5 were leading at that time:
This shows how each of the Fab 5 were performing relative to the benchmark S&P 500. 4 of the 5 were situated on the right side of the chart in the leading or weakening quadrants. This means they were relative leaders. Now, just a handful of weeks later, check out how these 5 stand relative to the S&P 500:
All 5 are currently residing on the left side of this chart, indicative of relative weakness, not strength. Momentum is building in the majority of the companies, so if that continues, we could begin to see relative outperformance of the Dow Jones again. For now, though, caution is the word.
One last thing. I’ve updated my Dow Jones Components ChartList and have numbered them 1 to 30, in price order, which reflects the highest-weighted to lowest-weighted stocks in the Dow Jones. I’m sorting this ChartList based on 1-month performances (SCTR scores are also reflected):
Of the 7 worst 1-month performers, 5 of them are in the Top 7 in terms of market weight. In other words, many of the worst recent performers in the Dow Jones also happen to be among the most heavily-weighted. Also, it’s important to note that many of the top-weighted Dow Jones stocks are also among the worst relative performers, as measured by SCTR scores (StockCharts Technical Rank, a form of relative strength). This combination is what has been crushing the Dow Jones. Until this changes, the Dow Jones will remain under relative pressure vs. the other major indices.
My Favorite Dow Jones Component
There are a number of ways to rank the potential of the various Dow Jones component stocks for 2025 and, obviously, it depends on your criteria. But I’ll be providing my FAVORITE Dow Jones stock (and why) for 2025 in Monday’s EB Digest, our 100% free newsletter. If you’re not already an EB Digest subscriber, and you’d like to check out my pick for 2025, please CLICK HERE and enter your name and email address. Again, it’s completely free and there’s no credit card required!
Happy trading!
Tom


