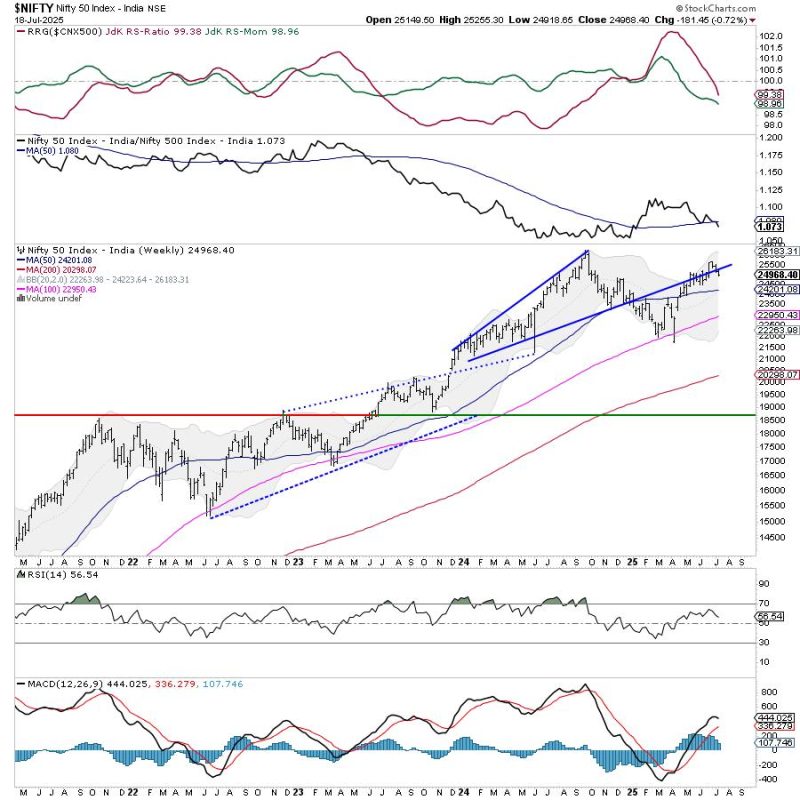
The Nifty traded in a broadly sideways and range-bound manner throughout the previous week and ended the week with a modest decline. The Index oscillated within a narrow 276-point range, between 25144.60 on the higher end and 24918.65 on the lower end, before settling mildly lower. The India VIX declined by 3.60% over the week to 11.39, suggesting continued complacency in the markets. On a weekly basis, Nifty ended with a net loss of 181.45 points or (-0.72%).
The Nifty is presently consolidating just below a key resistance zone after attempting a breakout above a rising channel. This zone, between 25100 and 25350, has proven to be a supply area where profit-taking has emerged. While the broader trend remains intact and the Nifty is above key moving averages, it is still within a complex zone of consolidation. This pause in momentum comes after a sharp up move from the lows near 21743 in April. A strong breakout above the 25265 –25350 zone, with a closing confirmation, may resume the uptrend. Conversely, a sustained move below 24750 could trigger incremental weakness and drag the Nifty towards lower supports.
As we head into the new week, the markets may see a cautious start amid the current range-bound setup. The immediate resistance is at 25150, followed by 25400. On the lower side, the key support zones are placed at 24750 and further near 24380.
The weekly RSI stands at 56.54 and remains neutral without showing any divergence against price. It has made a fresh 14-period low, which is bearish. The MACD remains above its signal line on the weekly chart, continuing to indicate a positive crossover. No significant candlestick formation was observed for the week.
From a pattern analysis perspective, Nifty is trading just below the upper bound of a rising channel that it had briefly broken out of. With the Index slipping below the support levels of 25000-25150, it faces resistance at this zone again, failing to follow through on the breakout. Price action is still above the 20-week and 50-week moving averages, maintaining a bullish undertone from a medium-term perspective. However, the ongoing sideways action indicates a lack of fresh directional conviction.
Given the current technical structure, it would be prudent for traders to remain selective and protect profits at higher levels. The markets are not displaying signs of aggressive strength, and unless there is a convincing move above 25350, a stock-specific approach with tight risk management is advised. Traders may avoid aggressive fresh buying until a directional move is clearly established. Cautious optimism, with a focus on stocks exhibiting stronger relative strength, is the ideal approach for the coming week.
Sector Analysis for the coming week
In our look at Relative Rotation Graphs®, we compared various sectors against the CNX500 (NIFTY 500 Index), representing over 95% of the free-float market cap of all the listed stocks.
Relative Rotation Graphs (RRG) show that the Nifty Media and the Metal Index have rolled inside the leading quadrant. The Midcap 100, Realty, and PSU Bank Index are also inside the leading quadrant. These groups are likely to relatively outperform the broader Nifty 500 Index.
The Nifty Bank, PSE, and the Financial Services Index are inside the weakening quadrant. They may experience a decline in relative performance compared to the broader markets.
The Nifty Services Sector Index, Pharma, Consumption, and the FMCG Index continue to languish inside the lagging quadrant. Among these groups, the Pharma Index shows improvement in its relative momentum against the broader markets.
The IT Index is inside the improving quadrant; it continues to improve its relative momentum against the benchmark. The Auto Index, which is also inside the improving quadrant, is seen deteriorating in relative momentum.
Important Note: RRG charts show the relative strength and momentum of a group of stocks. In the above Chart, they show relative performance against NIFTY500 Index (Broader Markets) and should not be used directly as buy or sell signals.
Milan Vaishnav, CMT, MSTA
Consulting Technical Analyst


