Face it, America. We are all each other’s BFFs.
‘Cause if misery loves company, we are not alone.
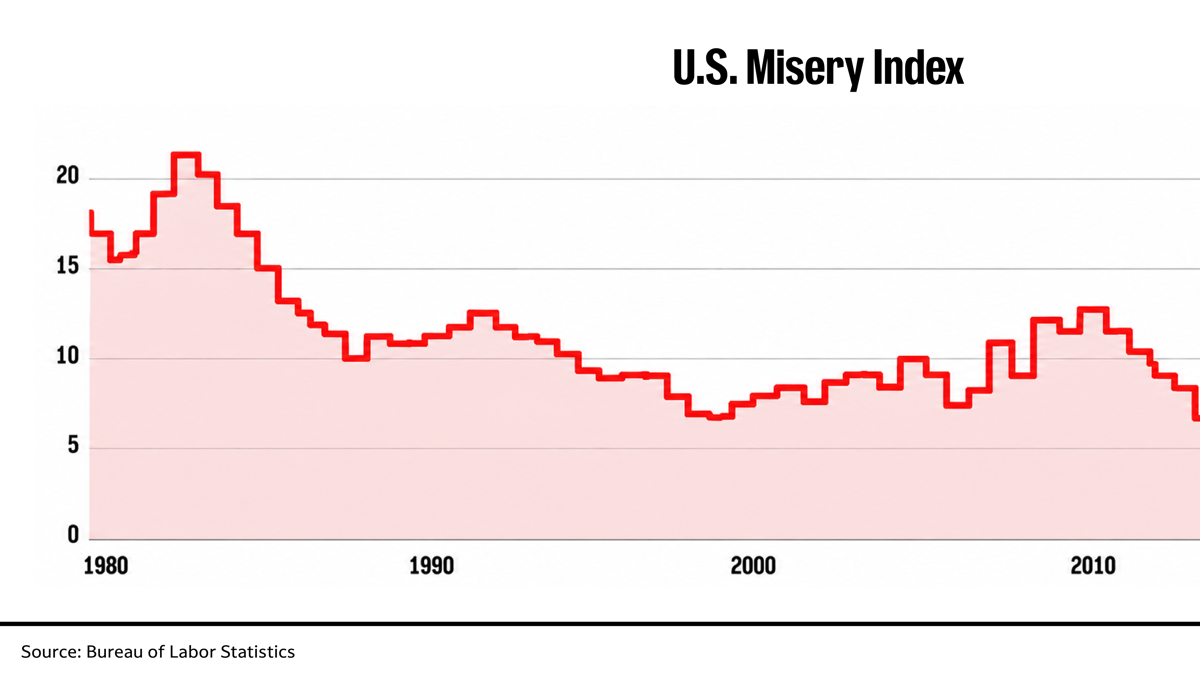
The federal government’s own official U.S. Misery Index is ticking up as Main Street is getting ticked off by persistent price pressures.
Yes, this is a real monthly economic indicator, calculated by adding a country’s annual unemployment rate to its inflation rate.
According to the U.S. Labor Department, the U.S. Misery Index is at a current level of 7.50, unchanged from 7.50 last month and up from 7.20 one year ago.
This is a change of 0.00% from last month but up a whopping 4.17% from one year ago.
“If you’re the average American household, you’re probably wondering, ‘What did I do to deserve this?’ ” RMS Chief Economist Joe Brusuelas told The Wall Street Journal.
Ya got that right, Joe.
Even Dollar General sales are in distress mode, as my colleague Madison Troyer reported Sept. 4 .
Here’s what the Misery Index measures
The U.S. Misery Index can be used as a gauge at how the economy is doing. Because of the components, this indicator tends to be highest when inflation or unemployment increases.
For example, one of the most notable time periods with regard to high inflation was the 1980s.
The U.S. Misery Index went as high as 21.98 in 1980 — no wonder we needed disco music and big hair.
TheStreet
Misery Index gauges inflation, jobs
The U.S. Misery Index was devised by noted economist Arthur Okun who served on President John F. Kennedy’s Council of Economic Advisers (CEA) and later led President Lyndon Johnson’s CEA.
The simple metric is designed to measure the economic well-being of the average citizen. It provides a quick, accessible snapshot of average financial discomfort.
Higher scores indicate greater economic distress for everyday consumers.
Here’s the economic equation that’s easy enough for English majors to master:
{Misery Index} = {Unemployment Rate} + {Annual Inflation Rate}.
Fed rate hikes, affordability and inflation
So these kitchen table challenges that we battle daily are being counted.
Plus, the buzzword “affordability” vibrating from our chapped lips is definitely sweeping political circles this midterm election year in all 50 states.
There was an audible groan in many homes and businesses when the Federal Reserve raised short-term borrowing costs on Sept. 11, thus impacting consumer loans like credit cards and student loans directly and indirectly, whacking Treasury yields, which influence those nearly 7% mortgages now on the books.
But the reason for the hike was to try to reduce some of these high prices inflating our lives.
It’s tricky, as I’ve reported, because:
The Fed’s dual mandate from Congress requires maximum employment and stable prices.
- Lower interest rates support hiring but can fuel inflation. This risks fueling further inflation, potentially leading to an inflationary spiral.
- Higher rates cool prices but can weaken the job market. This increases the cost of borrowing and further stifles economic activity.
Even without the recent tariffs from trade wars and the energy shocks from the Iran War, the underlying inflation concerning Fed policymakers took awhile to climb to current levels.
Hence, it’s probably going to take a few more rate hikes to take effect, even as the stock market soars and corporate earnings are fat and happy with artificial intelligence dreams that hijack the financial headlines.
Wages lagging behind rising prices
So, thanks to the U.S. Misery Index, we know it’s not just our raw emotions boiling over.
We’re all becoming more unhappy if not a tad unhinged by higher prices as shown by the August Consumer Price Index for energy, groceries, airline tickets, cell phones, child care — well, everything. Plus a sack of kitty litter or bird seed. Even the price of food served at U.S. elementary and secondary schools has nearly doubled since August 2006.
While the most recent U.S. jobs report remains stable at 4.1%, our wages are not keeping up with the costly demand to support ourselves and our families.
As my colleague Robert Powell, CFP(r), RMA(r) pointed out to me Sept. 15, wages are not keeping pace with prices, according to the Labor Department.
Labor share — the fraction of economic output that accrues to workers as compensation in exchange for their labor — in the nonfarm business sector was 52.8% in the second quarter of 2026, the lowest level ever recorded.
Related: Gas Prices are about to defy everything drivers expect
- The labor share of income measures the percentage of economic output in the nonfarm business sector that flows to workers as compensation (wages, salaries, and employer-paid benefits) rather than to owners of capital (corporate profits, dividends, interest, and retained earnings).
- The drop to 52.8% — the lowest reading on modern record — signals that the division between labor and capital has skewed further toward capital than at any point since data collection began in 1947.
- Workers generally have a higher marginal propensity to consume (they spend a larger fraction of every dollar earned on immediate living expenses) compared to high-net-worth capital owners and corporations.
- A declining share going to workers can dampen baseline consumer spending over time, creating a drag on domestic economic demand unless offset by increased household borrowing or capital expenditure.
Misery Index creates a big tent
For many working Americans, all of this means less money to save, less money to invest, less money period.
I’m still steaming over what I just paid to fill my aging Honda Fit’s tank and pick up some whitening toothpaste plus shelling out my remaining cash for a pound of fresh (because it’s low-cholesterol friendly) Atlantic salmon.
Yet now there’s economic proof that not only measures my shrinking personal financial status but puts a name on it, I feel a tad empowered knowing I’m counting my pennies next to you in a really, really big tent.
Maybe it’s time to cue the disco music.
Related: Dollar General has a plan to help customers find more deals