If you’ve looked at enough charts over time, you start to recognize classic patterns that often appear. From head-and-shoulders tops to cup-and-handle patterns, they almost jump off the page when you bring up the chart. I would definitely include Fibonacci Retracements on that list, because before I ever bring up the Fibonacci tool on StockCharts, I’m pretty confident the levels are going to line up well with the price action.
Today, we’re going to look at a breakout name that shows why Fibonacci Retracements can be so valuable for confirming upside potential. We’ll also explain some best practices for identifying the most important price levels to use when setting up a Fibonacci framework. Finally, we’ll show how Fibonacci analysis could have helped you validate the current uptrend phase for the S&P 500 index.
Confirming Breakouts: Norwegian Cruise Line Holdings (NCLH)
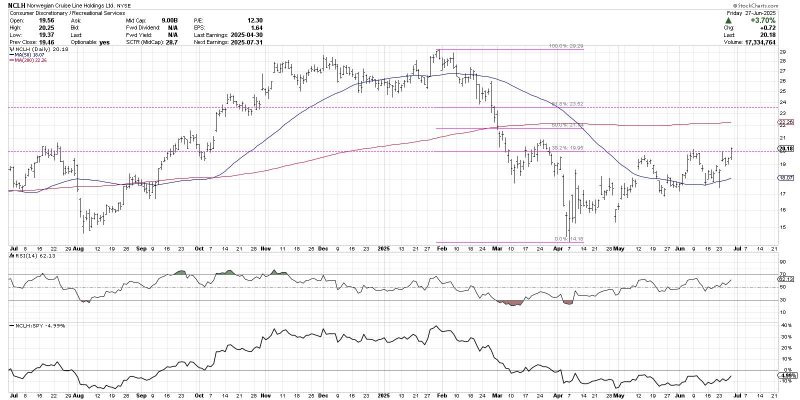
I started dropping quite a few Fibonacci Retracements on price charts soon after the April 7, 2025 market low. As stocks experienced a sudden and severe bounce off those lows, it became clear that we would need some way to validate a potential upside swing. That helped me zero in on the $20 level for Norwegian (NCLH), a level which was finally eclipsed this week.
Using the January high and the April low, we can see a 38.2% Fibonacci level come in right around $20. A gap higher in mid-May took NCLH close to that level, which was then retested again in early June. After bouncing off the 50-day moving average last week, Norwegian finally pushed above this first Fibonacci resistance level with Friday’s rally.
One of the ways we can differentiate between a “dead cat bounce” off a major low and the beginning of a much larger recovery phase is to key in on the first Fibonacci retracement level. If the price can push above this initial upside target, ideally on heavier than normal volume, then the chances of further upside are significantly increased.
In the case of NCLH, we can now bump up a price target to further Fibonacci levels. The 50% line, just below $20, lines up fairly well with the 200-day moving average. The 61.8% comes in right around $23.50, which represents my next upside target, assuming this week’s strength is confirmed by a follow-through day next week.
Identifying Pullbacks: Raytheon Technologies (RTX)
We can also use Fibonacci Retracements to identify downside targets after a major price peak. In the case of Raytheon Technologies (RTX), that means we use the April low and the high from mid-June to generate potential support levels.
In this case, we can see that the Fibonacci retracement levels line up very well with traditional support levels using the price action itself. The 38.2% level lines up with the mid-June low around $135, which also coordinates with the 50-day moving average. Beyond that support, the 50% level sits right at the late May low at $131, and the 61.8% level comes in right around the early May support at $126.
Given an initial pullback from the June peak around $149, I’m seeing strong potential support at the 38.2% level and 50-day moving average around $135. Now I can use Fibonacci levels to better define my risk vs. reward, showing how much downside action I’d anticipate while still keeping an eye on a return to the previous all-time highs.
Validating Uptrends: The S&P 500 Index ($SPX)
Sometimes Fibonacci Retracements are valuable in that they help validate that an uptrend is progressing with a decent pace. For the S&P 500 chart, every break of a Fibonacci resistance level has confirmed the strength of the broad market indexes off the April low.
It took only two sessions for the SPX to break above the 38.2% retracement of the February to April downtrend phase. In fact, the S&P almost reached the 50% level before pulling back to around 5100 in mid-April. From there, we can see a gap back above the 38.2% level, which helped confirm the strength of the new uptrend phase.
I still have the pink trendline on my chart that I remember drawing during the downtrend phase. “As long as the S&P remains below trendline resistance, the market is in a clear downtrend,” I remember saying out loud on my market recap show. So when the SPX broke above the 50% level, as well as that clear trendline, I was forced to acknowledge the staying power of this new uptrend phase.
The S&P 500 stalled out at the 61.8% retracement level in early May, but another price gap higher signaled that the final Fibonacci resistance level was no longer going to hold. And once you eclipse the final Fibonacci level, that implies a full retest back to the 100% point.
So am I surprised that the S&P 500 has pushed to new all-time highs this week? Absolutely not. Indeed, using Fibonacci Retracements on charts like this have helped me admit when a new uptrend is showing strength, and provide plenty of reminders to follow the trend until proven otherwise!
RR#6,
Dave
P.S. Ready to upgrade your investment process? Check out my free behavioral investing course!
David Keller, CMT
President and Chief Strategist
Sierra Alpha Research LLC
https://www.youtube.com/c/MarketMisbehavior
Disclaimer: This blog is for educational purposes only and should not be construed as financial advice. The ideas and strategies should never be used without first assessing your own personal and financial situation, or without consulting a financial professional.
The author does not have a position in mentioned securities at the time of publication. Any opinions expressed herein are solely those of the author and do not in any way represent the views or opinions of any other person or entity.


