Updated 16 September 2026
Spot gold: $4,326.17/oz, up $33.87 (+0.79 percent) on the day, reclaiming the $4,300 handle after a two-session decline (Trading Economics, 16 September).
Verdict: the hike itself is close to fully priced. The tradeable variable today is the dot plot, not the 25 basis points. Bear $4,000, base $4,500, bull $4,900 on year-end bank targets.
Key facts
- Gold trades at $4,326.17 an ounce on 16 September, up $33.87 (+0.79 percent), after ending a two-session slide as energy prices stabilised (Trading Economics).
- Tuesday was a six-week low. Physical gold closed 15 September at $4,263.19, down $53.15 (-1.23 percent), as the dollar firmed ahead of the Fed (USAGOLD daily precious metals report, 15 September).
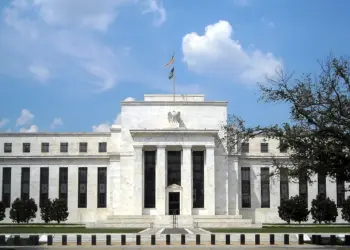
- The FOMC decides today at 2:00pm ET. This is a Summary of Economic Projections meeting, so the updated dot plot lands alongside the decision.
- A 25 basis point hike is the consensus and would be the first increase since 2023. CME FedWatch has run between 85.6 percent and 91 percent in the past fortnight; Kalshi and Polymarket priced roughly 81 percent after the August CPI print.
- The dollar and oil did the damage. The Dollar Index reached 99.57, its highest since 3 September, while WTI crude climbed about 15 percent this month to near $99 after Saudi Arabia shut a major East-West pipeline.
- Gold is well off its record. The all-time high of $5,589.38 was set on 28 January 2026, leaving the metal roughly 23 percent below that peak.
Why gold sold off into a meeting it should have liked
The intuitive trade is that an inflation problem is good for gold. That is not how the past month has traded. The August CPI report showed prices rising 0.4 percent month-over-month, holding the annual rate at 3.4 percent, with core measures still well above the Fed’s 2 percent target. Instead of buying gold as an inflation hedge, the market bought the Fed’s response to inflation: higher policy rates, higher real yields, and a firmer dollar. All three are headwinds for a non-yielding asset.
The oil shock sharpened it. WTI near $99, up roughly 15 percent this month after the Saudi East-West pipeline closure, is a supply-side inflation impulse. Supply-side inflation is the kind central banks are least able to fix and most likely to respond to with tighter policy, which is why an energy spike pushed hike odds up and gold down rather than the reverse.
That dynamic reversed slightly on Wednesday. With energy prices stabilising, gold climbed back above $4,300 and recovered most of Tuesday’s loss before the decision.
The hike is priced. The dot plot is not.
This is the part that matters for anyone positioning today. Prediction and futures markets have converged on a hike, and the range across venues is now narrow rather than wide:
- CME FedWatch: 85.6 percent rising to about 91 percent for a quarter-point hike at the 16 September meeting.
- Kalshi and Polymarket: roughly 81 percent cross-venue after the hotter August core inflation reading.
- Sell side: Goldman Sachs and J.P. Morgan both shifted to forecasting the hike, aligning with futures pricing near 87 percent.
Worth noting how fast this repriced. On 15 August, a Kalshi contract paying out on a September hike traded at 26 cents. By 2 September it was 58 cents. Three things moved it: the Fed held at 3.50-3.75 percent in July on a 9-3 vote with three members dissenting in favour of a hike; July PCE inflation came in at 3.7 percent, above forecast; and on 28 August at Jackson Hole, Chair Warsh said the Fed’s predominant focus right now should be on prices.
When an outcome is 85 to 91 percent priced, delivering it is not a catalyst. The catalyst is the projection material. Three or more additional hikes signalled through 2027 would be a hawkish surprise and the trigger for a genuine gold selloff. A dot plot implying only one more move would be a dovish repricing relative to what is in the curve, and gold would likely take the $4,422 resistance area.
Levels that matter
Gold is forming a hammer candle after testing the 50-day simple moving average at $4,271 and reclaiming $4,300. On the downside, the reference points below spot are September’s second low at $4,282 and that 50-day average at $4,271. A break below $4,250 opens the $4,120 to $4,160 zone. On the upside, resistance sits at the 100- and 200-hour moving averages near $4,422.
Scenarios into year-end
The anchors below are published year-end 2026 targets from named institutions, not our own projections. Spot is $4,326.
| Scenario | Level | Anchor and what gets you there |
|---|---|---|
| Bear | $4,000 -7.5 percent |
The low end of the $4,000 to $4,900 year-end band that Goldman Sachs, HSBC, J.P. Morgan and StoneX have revised toward on the view that the Fed does not cut in 2026. Technically this needs a break of $4,250 first, which opens $4,120 to $4,160. |
| Base | $4,500 +4.0 percent |
J.P. Morgan’s year-end target and the bottom of the bank cluster. Assumes one hike delivered, a dot plot that does not escalate, and continued central bank reserve buying. |
| Bull | $4,900 +13.3 percent |
Goldman Sachs’ year-end 2026 target, cut to this level from $5,400 on 20 June as ETF inflows faded. Needs a dovish dot plot and a dollar that rolls over from 99.57. |
For context on how wide the professional range still is: Morgan Stanley and UBS sit at $5,200 for year-end, and UBS carries a December marker as high as $5,900. Those are outside the scenario band above because they assume a policy path the September dot plot is unlikely to endorse.
Quick Take
Gold at $4,326 has already absorbed a 25 basis point hike at 85 to 91 percent confidence. Buying or selling the decision itself is buying or selling something the curve has held for a fortnight. The asymmetry is in the projections: a 2027 path showing three or more further hikes breaks $4,250 and puts $4,120 to $4,160 in play, while a path showing one more move sends gold at $4,422. Central bank reserve demand remains the structural bid underneath all three scenarios.
What else is moving with it
Gold is not trading in isolation today. The same hike expectation has pushed the 10-year Treasury yield toward 5.025 percent, and the divergence between venues pricing this meeting is covered in our breakdown of Polymarket versus CME FedWatch hike odds. The oil leg of the story sits in our coverage of the East-West pipeline closure and Brent, and our previous gold read after the August CPI print is here.
FAQ
What is the gold price today?
Spot gold trades at $4,326.17 an ounce on 16 September 2026, up $33.87 or 0.79 percent on the day (Trading Economics). It closed the previous session at $4,263.19, a six-week low.
Will the Fed raise rates today?
Markets price it as the strong favourite. CME FedWatch has run between 85.6 percent and 91 percent for a 25 basis point increase; Kalshi and Polymarket price roughly 81 percent. A hike would be the first since 2023. Nothing is certain until the 2:00pm ET statement.
Why does a rate hike hurt gold?
Gold pays no yield. When policy rates and real yields rise, the opportunity cost of holding a non-yielding asset rises with them, and the dollar typically strengthens, which makes gold more expensive in every other currency. That is why the Dollar Index at 99.57 has coincided with gold at a six-week low.
Why is the dot plot more important than the decision?
Because the decision is already in the price at 85 to 91 percent. The Summary of Economic Projections shows where committee members expect rates to go through 2027. Three or more further hikes on that path would be a hawkish surprise; a single additional move would read as dovish against current pricing.
How far is gold from its record high?
The all-time high in US dollars is $5,589.38, set on 28 January 2026. At $4,326 gold sits roughly 23 percent below that peak.
What would break gold below $4,000?
Sequentially: a loss of $4,250, which opens the $4,120 to $4,160 zone, followed by a 2027 rate path that keeps real yields elevated through the fourth quarter. That is the scenario behind the lower end of the $4,000 to $4,900 band the major banks have revised toward.
What are banks forecasting for year-end 2026?
Goldman Sachs is at $4,900, cut from $5,400 in June. J.P. Morgan is at $4,500. Morgan Stanley and UBS are at $5,200, with UBS carrying a December marker of $5,900. Goldman, HSBC, J.P. Morgan and StoneX have collectively revised into a $4,000 to $4,900 range on the assumption the Fed does not cut this year.
Sources: Trading Economics (spot gold, 16 September 2026); USAGOLD daily precious metals market report (15 September 2026); CME FedWatch; Kalshi; Polymarket; Goldman Sachs, J.P. Morgan, UBS, Morgan Stanley and HSBC published forecasts; US Bureau of Labor Statistics August CPI.
This article is for informational purposes only and does not constitute financial advice. Commodity and currency markets carry substantial risk of loss. Prices quoted were accurate at the time of writing and move continuously. Always conduct your own research and consider consulting a licensed financial adviser before making investment decisions.